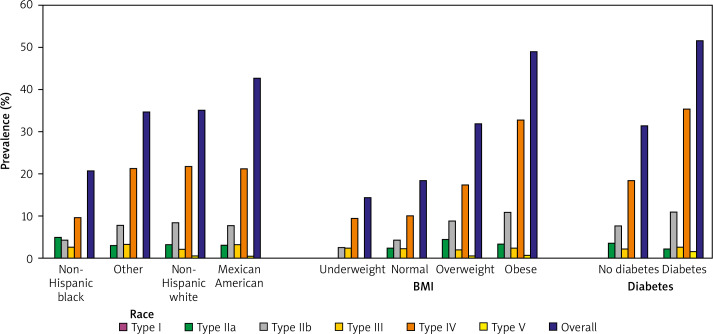
Figure 2.
FLL phenotype prevalence by race, BMI, and diabetes
BMI – body mass index (underweight: < 18.5; normal: ≥ 18.5 and < 25; overweight: ≥ 25 and < 30; obese: ≥ 30). Prevalence by race was marginally adjusted for age and sex, while prevalences by BMI and diabetes were marginally adjusted for age, sex, and race.

