Figure 3.
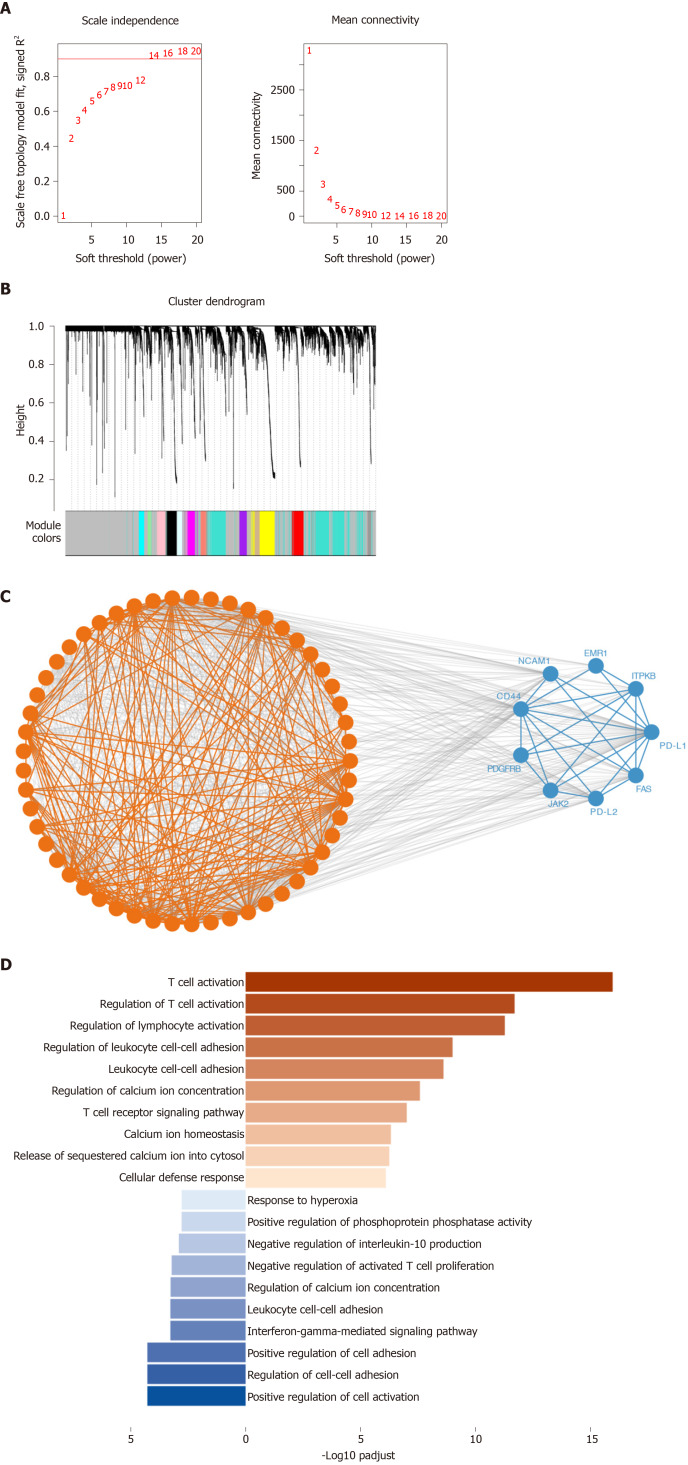
Co-expression analysis of genes associated with programmed death 1, programmed death ligand 1, and programmed death ligand 2. The weighted correlation network analysis (WGCNA) and string datasets were used to select the co-expressed genes. We used WGCNA to identify gene-related modules, and then used STRING database to determine the true interaction of genes. A: Soft threshold selected in the WGCNA analysis. We selected the threshold for R2 to exceed 0.9 for the first time as the soft threshold, and for subsequent analysis 14 was selected as the threshold; B: Distribution of genes in WGCNA; C: Protein-protein interaction of the co-expression genes in the STRING datasets. We put the module genes obtained by WGCNA analysis into the STRING database for protein interaction analysis; D: Biological processes of Gene Ontology (GO) analysis in the co-expression gene. The top ten enrichment results are used for visualization. PD-L1: Programmed death ligand 1; PD-L2: Programmed death ligand 2.

