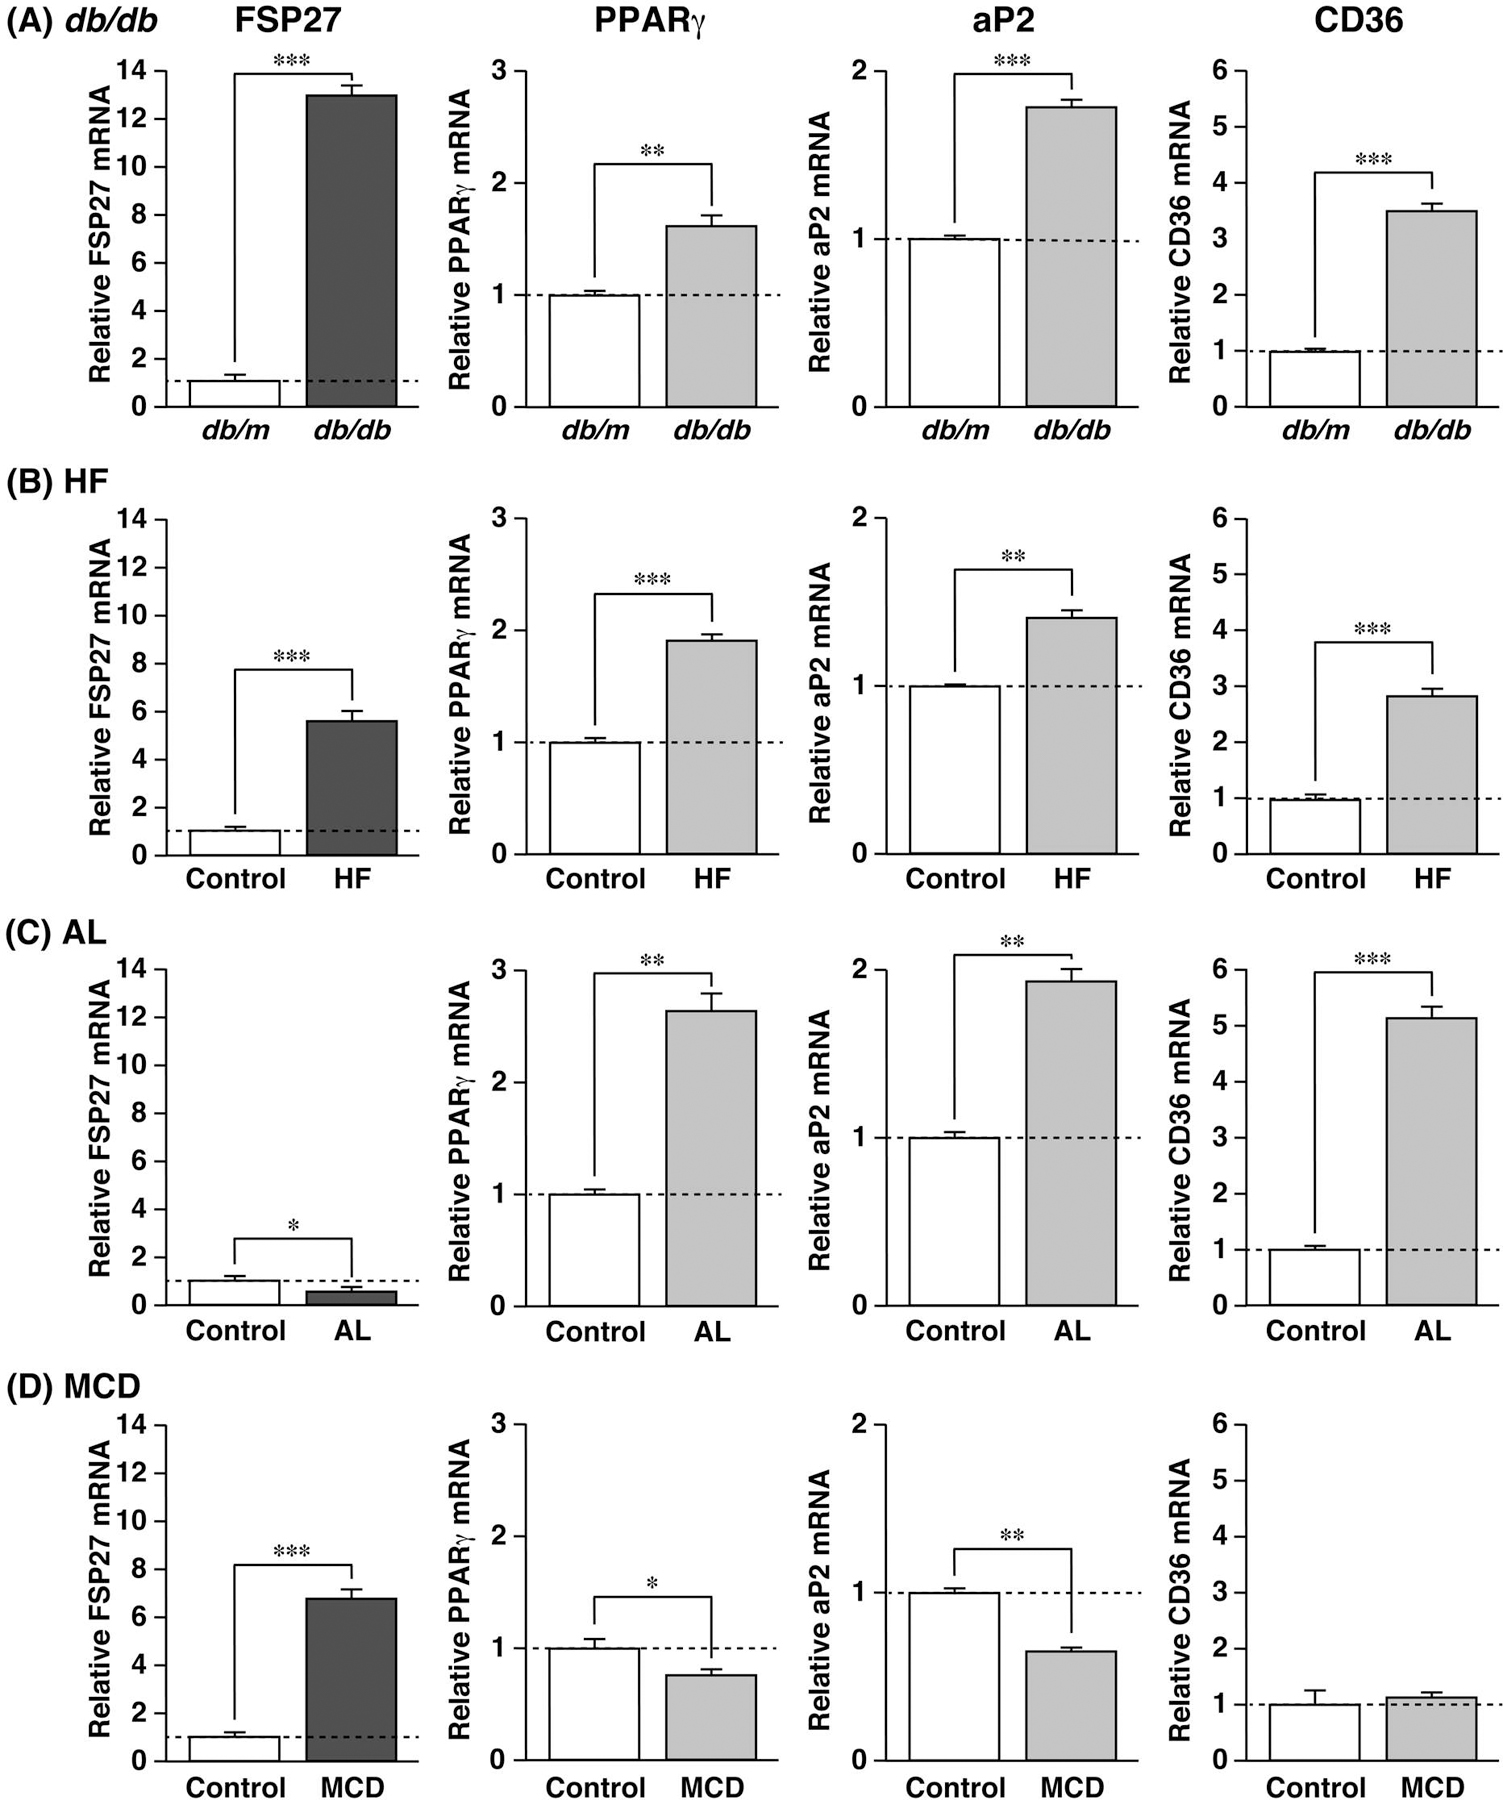
Fig. 2. FSP27 Gene Expression in Fatty Livers Developed by Different Methods.

QPCR analyses of FSP27, PPARγ, aP2, and CD36 mRNAs were performed using liver samples from each group. Expression of each mRNA was examined in genetically modified (A) leptin receptor-mutated mice (db/db), as well as in mice fed diets comprising either (B) high fat (HF), (C) alcohol (AL), or (D) lacking methionine and choline (MCD). Expression was normalized to 36B4 mRNA, and each bar represents the average±S.E.M. of 3 individual experiments. Significant differences from db/m mice or control diet: * p<0.05, ** p<0.01, *** p<0.001.
