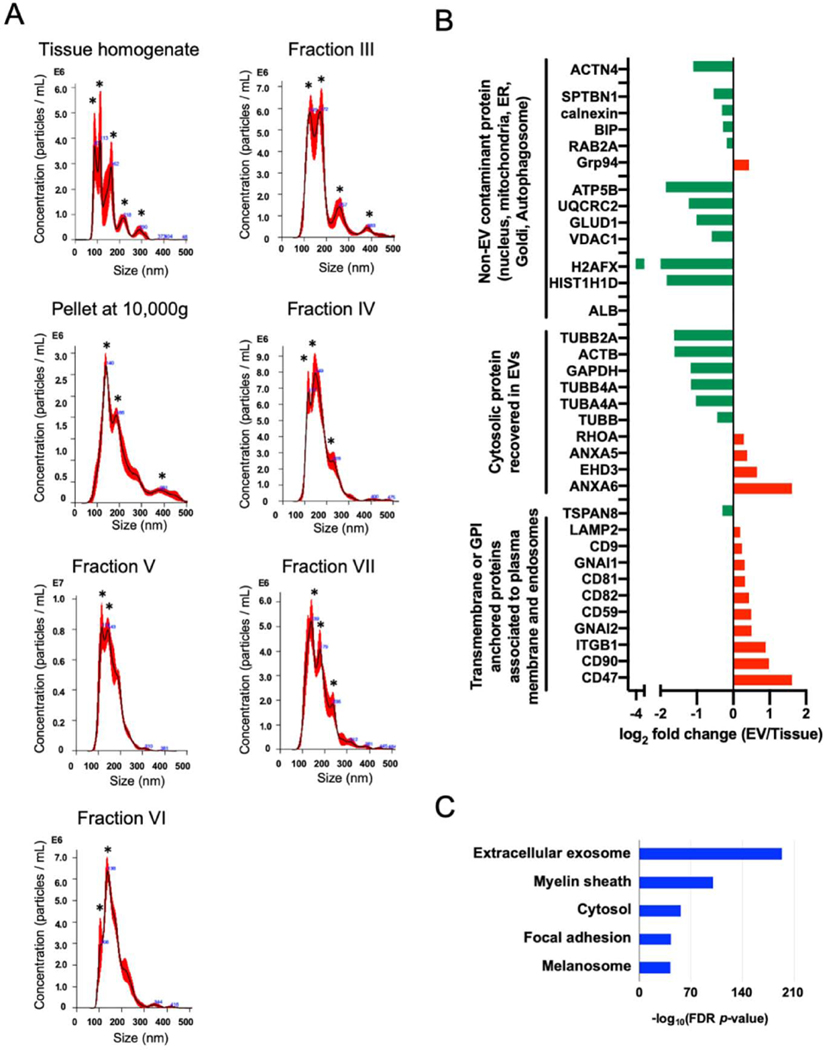
Figure 2. Characterization of EVs separated from unfixed human brain tissues by SG-UC method.
A) NTA plot of mode size and concentration of separated EVs (tissue homogenate, pellets after 10,000g, fraction III, IV, V, VI, VII after SG-UC); The black line shows the fitting curve. Red line represents the error bar. Y axis: EV particle counts [/mL], X axis: EV particle size [nm]. A peak was indicated with black asterisk. B) The bar charts of EV protein or non-EV protein in separated EV. Y axis: EV marker protein or non-EV marker protein, X axis: log2 fold change (EV/brain tissue homogenates). Red bar shows the proteins are enriched in EVs. Green bar shows the proteins are enriched in brain tissue homogenates. C) DAVID (Bioinformatics Resources 6.8) GO terms of Top10 ‘Cellular Components’ with -log10(FDR p-value).

