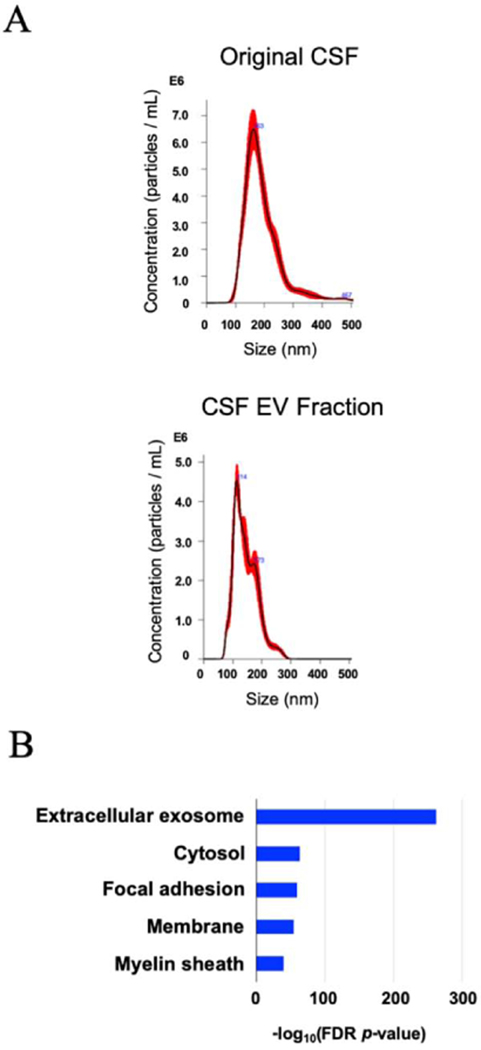
Figure 6. Characterization of EVs separated from human CSF by AC method.
A) NTA plot of mode size and concentration of separated EVs by AC method; The black line shows the best-fitting curve. Red line represents the error bar. Y axis: EV particle counts [/mL], X axis: EV particle size [nm]. B) DAVID GO terms of Top10 ‘Cellular Components’ with - log10(FDR p-value).

