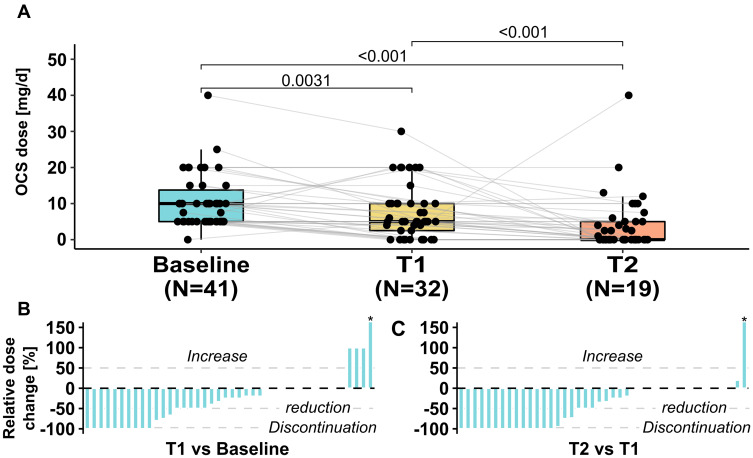
Figure 3.
(A) Boxplots with individual OCS doses at baseline, under anti-IL5 (T1) and anti-IL5Rα (T2) therapy. The relative dose change of each patient receiving OCS is shown as waterfall plots in (B and C). Patients who never received OCS at any time are not considered in the graph or median dose calculations. *One patient at T1 and T2 newly received OCS and relative dose change is arbitrarily displayed as 150%.
Abbreviation: OCS, oral corticosteroids.

