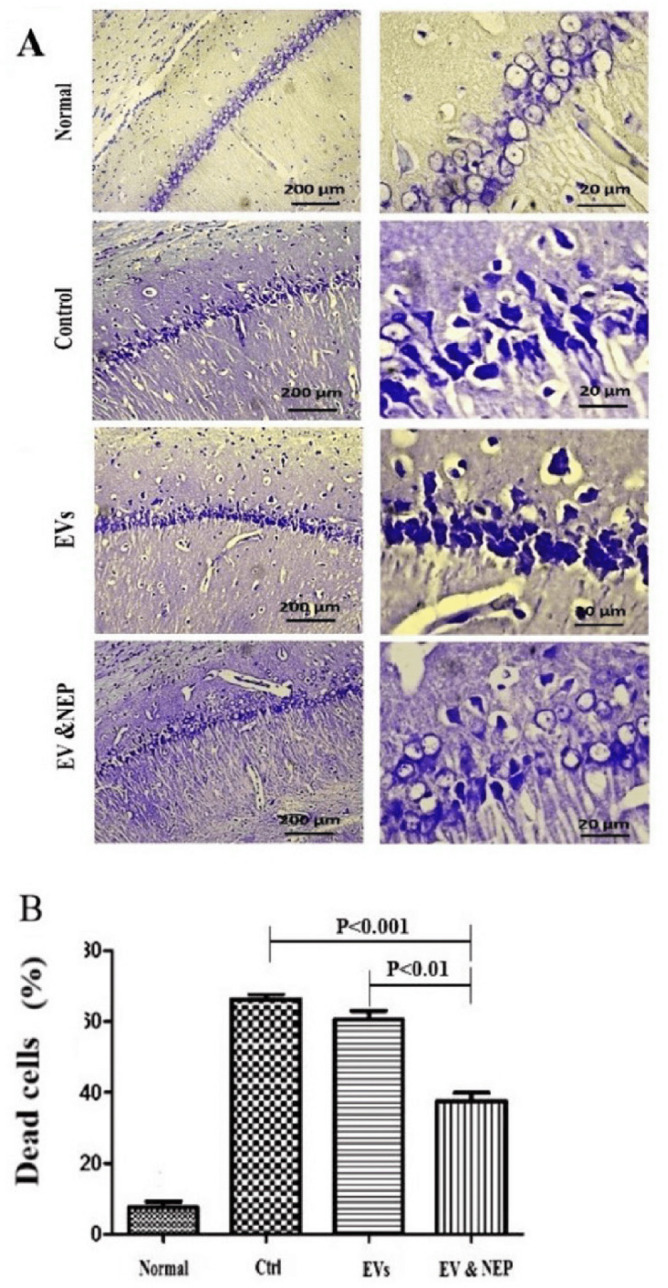
Figure 6.

The effect of intranasal EV-loaded NEP administration on hippocampus neuronal damage. (A) Representative micrographs of Nissl stained sections resulted in Normal, Control, EVs, and EV-loaded NEP groups, Scale bars: 200μm and 20μm and (B) percentage of dead cells, indicated significantly decrement in CA1 neuronal cell death count in EV-loaded NEP delivered rat brains compared to control (p < 0.001) and EVs (p < 0.01) groups after 14 days treatment; (n = 4 in each group, the dead cell results were quantified with ImageJ software and the differences between groups were determined by ANOVA followed by Tukey test). Defined groups are Normal, Ctrl: received PBS, EVs: received EVs, EV&NEP: received EV-loaded NEP in the treatment period
