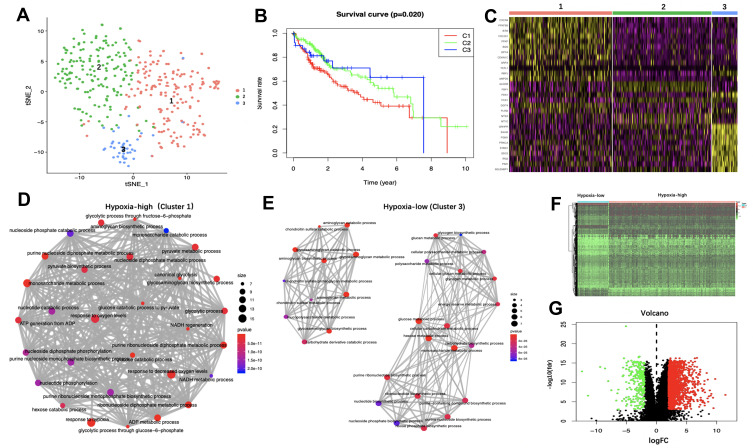
Figure 1.
Identification of hypoxia status and hypoxia-related differentially expressed genes (DEGs). (A) Dot plot for three distinct clusters identified by t-SNE algorithm based on 200 hypoxia hallmark genes. (B) Kaplan–Meier plot of overall survival for patients in three clusters. (C) Heatmap of the marker genes of the three clusters. The Gene Ontology (GO) of biological process (BP) analysis of the marker genes in Cluster 1 (D) and Cluster 3 (E) are shown. The thickness of the gray line represents the degree of association between GO terms. Heatmap (F) and volcano plot (G) demonstrating differentially expressed hypoxia-related genes between hepatocellular carcinoma (HCC) and non-tumor tissues. Red dots represent differentially up-regulated expressed genes, green dots represent differentially down-regulated expressed genes and black dots represent no differentially expressed genes.
Abbreviations: N, normal tissue. T, tumor.

