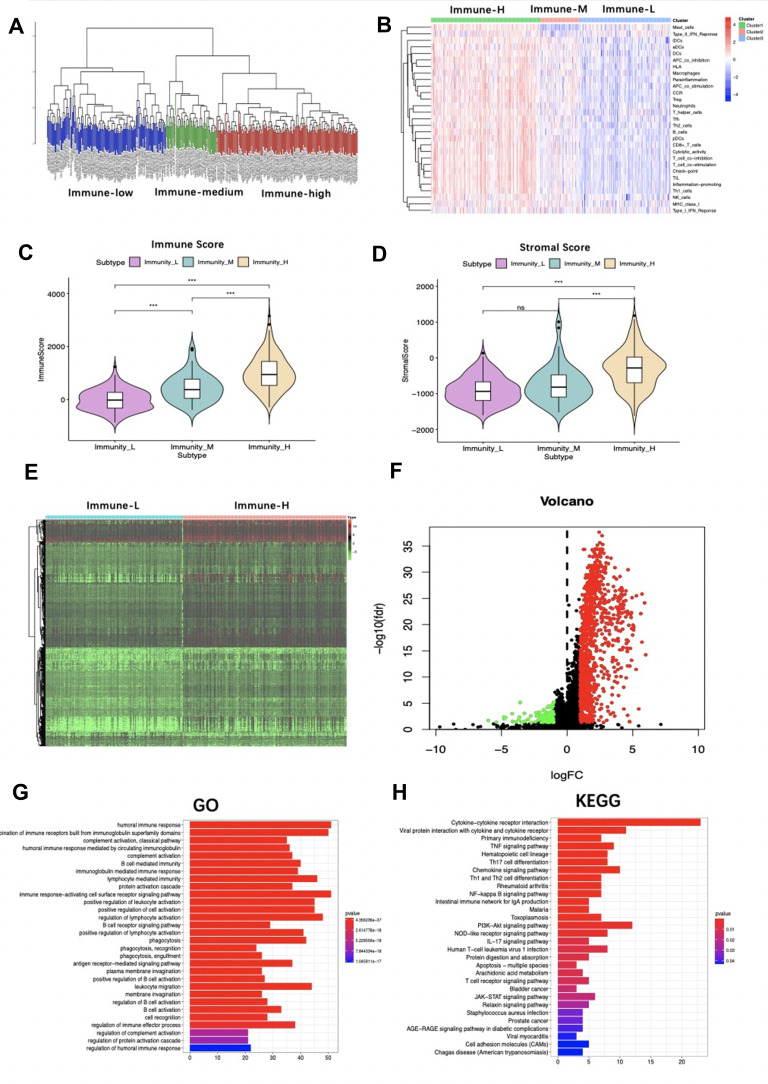
Figure 2.
Analysis of immune status of the Cancer Genome Atlas (TCGA) patients. (A) Hierarchical clustering of hepatocellular carcinoma (HCC) yields three subtypes (immune-high group, immune-medium group and immune-low group) in the TCGA database. (B) Different immune status of the three groups. Comparison of (C) immune score and (D) stromal score between immune-high and immune-low groups are shown. (E) Heatmap and (F) volcano plot demonstrating differentially expressed genes between immune-high and -low groups. Red dots represent differentially up-regulated expressed genes, green dots represent differentially down-regulated expressed genes and black dots represent no differentially expressed genes. (G) The Gene Ontology (GO) and (H) Kyoto encyclopedia of genes and genomes (KEGG) analysis of differentially expressed genes between immune-high and -low groups. ***P<0.001.
Abbreviation: ns, no significance.

