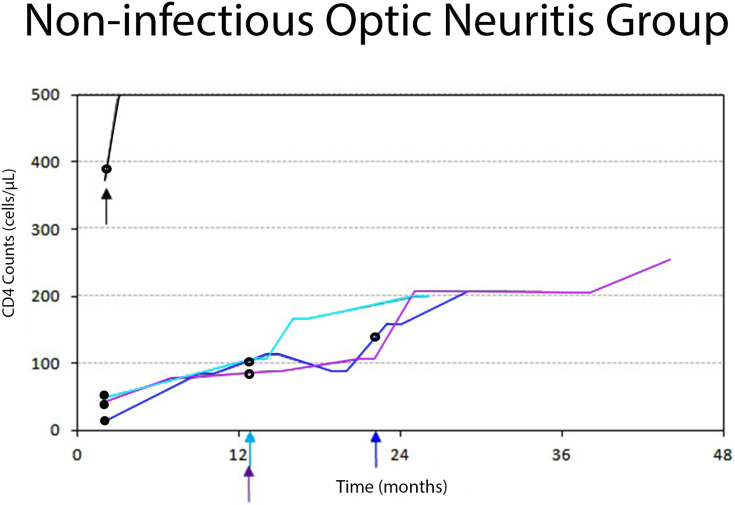
Figure 3.
Diagram showing individual trajectories of the CD4 cell count over time in the non-infectious (immune-mediated) ON group. Each color line and the corresponding arrow color represents each patient. Small arrows represent acute ON attacks. Black dots represent antiretroviral initiation. Black rings represent steroid treatments. Three patients (blue, light blue, and purple lines) successfully achieved HIV infection control. They developed acute ON while their CD4 cell counts were rising, and HIV viral load became undetectable. A female patient (black line), who did not receive ART, developed NMOSD-ON while her CD4 cell counts were 371 cells/µL. All the patients in this group did not have opportunistic infections and were responsive to corticosteroid treatments.

