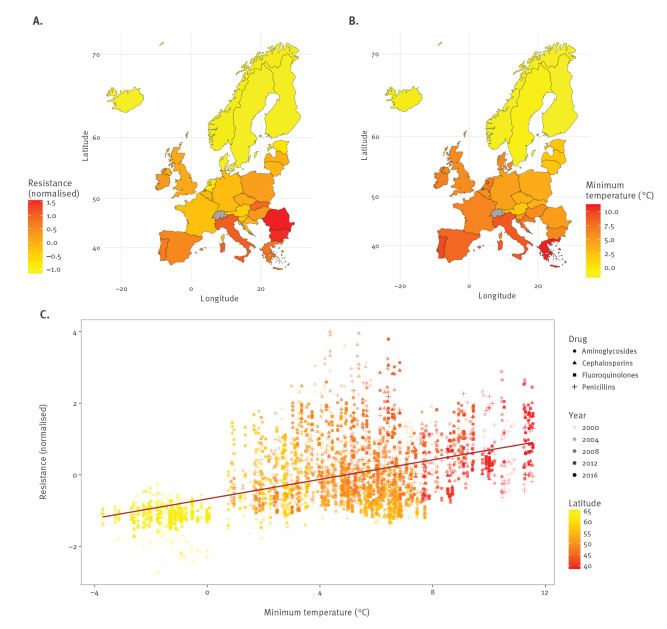
Figure 1.
Antibiotic resistance increases with increasing minimum temperature, European Union/European Economic Area countries and the United Kingdom, 2000–2016
(A) Map with the mean normalised antibiotic resistance for three common pathogens (Escherichia coli, Klebsiella pneumoniae, and Staphylococcus aureus).
(B) Map with the annual average minimum temperature (°C) between 2000–2016, for 28 European countries.
(C) Unadjusted linear trend line estimating the linear relationship between annual average minimum temperature and normalised resistance, across all countries and pathogens and years. The transparency of the points in the scatter plot (represented by increasingly dark shades of grey) correspond to data collection year, and are coloured by latitude. Antibiotic subclasses are represented as geometric shapes.

