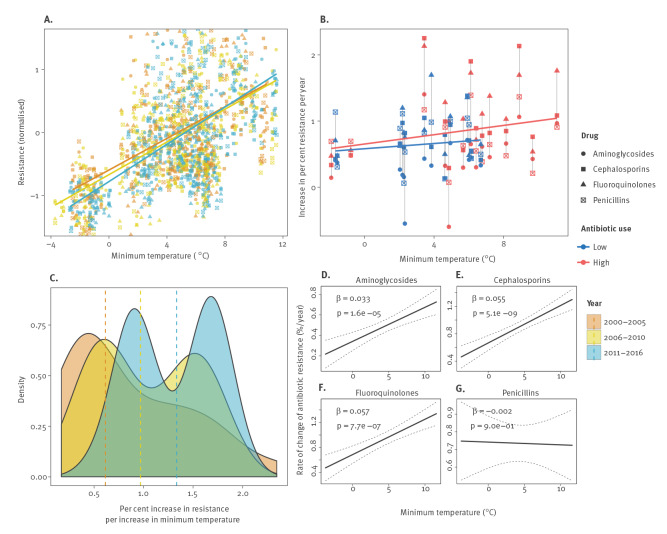
Figure 2.
Change in the relationship between antibiotic resistance and minimum temperature over time for Escherichia coli, European Union/European Economic Area countries and the United Kingdom, 2000–2016
(A) Normalised antibiotic resistance versus annual average minimum temperature (°C) for four antibiotic subclasses and all 28 countries, stratified by 5–6 year intervals.
(B) Speed of increase of antibiotic resistance versus annual average minimum temperature, stratified by average antibiotic consumption (low/high). Each country is represented by a collection of vertical points. The average antibiotic consumption for each country – over all drug classes and years – was compared to the median average antibiotic consumption across all 28 European countries. Countries with average antibiotic consumption less than the median across Europe were considered to have low antibiotic use (blue); with greater than the median, high antibiotic use (red).
(C) The changing association between annual average minimum temperature and antibiotic resistance over time. Distributions of the association between antibiotic resistance and minimum temperature (unadjusted linear model slopes) across multiple years and four antibiotic subclasses are shown, stratified by three time intervals (2000–2005; 2006–2010; 2011–2016). The median slope for each interval is marked by a vertical dashed line. Associations further to the right indicate stronger (steeper) relationships.
(D–G) Change of antibiotic resistance over time as a function of annual average minimum temperature for (D) aminoglycosides, (E) 3rd-generation cephalosporins, (F) fluoroquinolones, and (G) aminopenicillins, with 95% confidence intervals. Estimates for all antibiotics were obtained from multivariable models adjusting for country, minimum temperature (°C), year, population density (persons/km2), antibiotic consumption (defined daily doses /1,000 inhabitants/day), and the interaction between year and minimum temperature. Beta coefficients and p values are given for the interaction between minimum temperature and year, with 95% confidence intervals calculated using the standard error of Equation 3,
where b2 and b3 are estimates of β2 and β3. Equation 3 (from which the derived standard error is presented here) is described further in the main text of the current report.

