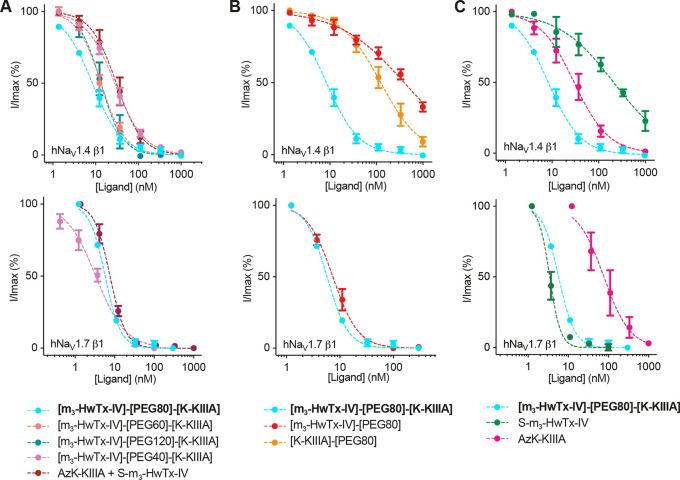
Figure 4.
Inhibitory activity of monovalent and bivalent ligands at hNaV1.4 and hNaV1.7. (A) Concentration–response curves for bivalent PEG40, PEG60, PEG80, and PEG120 constructs, and an equimolar mixture of AzK-KIIIA and S-m3-HwTx-IV. (B) Concentration–response curves for bivalent PEG80 and AzK-KIIIA or S-m3-HwTx-IV conjugated to PEG80. (C) Concentration–response curves for bivalent PEG80 and monovalent peptides AzK-KIIIA and S-m3-HwTx-IV. For these experiments, we used HEK293 cells that stably express either NaV1.7 or NaV1.4 along with the β1 auxiliary subunit. Data are from experiments in which five to seven increasing concentrations of ligand were added to cells. Data points are means ± SEM of three or four independent experiments. (Note that for some concentrations the error bar is smaller than the symbol.) Fitting of the normalized concentration–response data yielded the IC50 values listed in Table 1.

