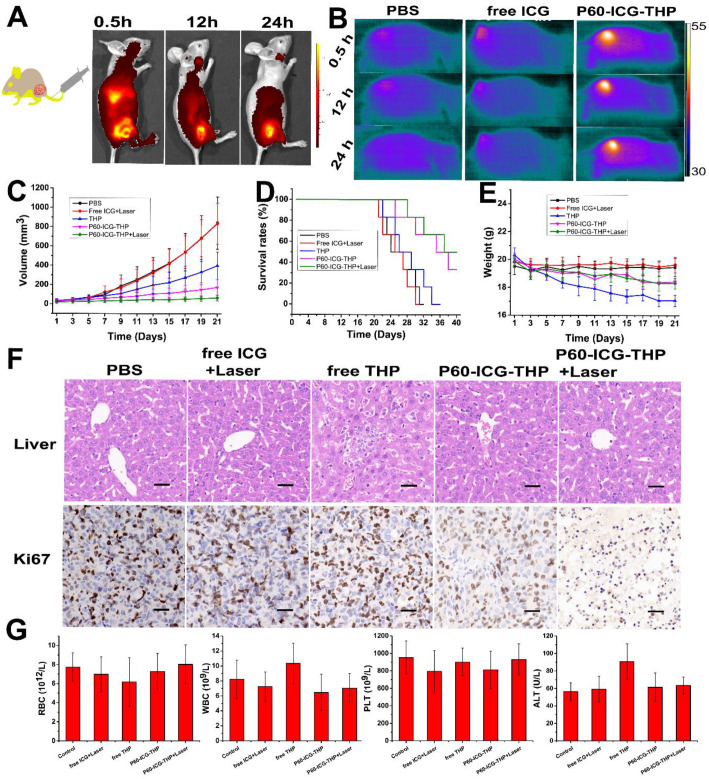
Figure 7.
(A) In vivo imaging and biodistribution in nude mice bearing MDA-MB-231 tumors after tail vein injection of P60-ICG-THP. (B) IR thermal images of nude mice bearing MDA-MB-231 tumors after tail vein injection of PBS, ICG, and P60-ICG-THP and exposed to an 808-nm laser for 5 min. (C) Tumor growth curves of different groups after different treatments. (D) Cumulative survival rates of mice bearing MDA-MB-231 tumors after different treatments. (E) Body weight changes in the different groups of mice during different treatments. (F) HE staining of liver collected from different groups. The red arrows show hepatocellular injury. The bottom row shows Ki67 staining of tumor sections collected from different treatment groups. Scale bar = 60 μm. (G) Blood biochemical levels and hematological parameters of the mice after treatment. (n = 3, *p < 0.01).

