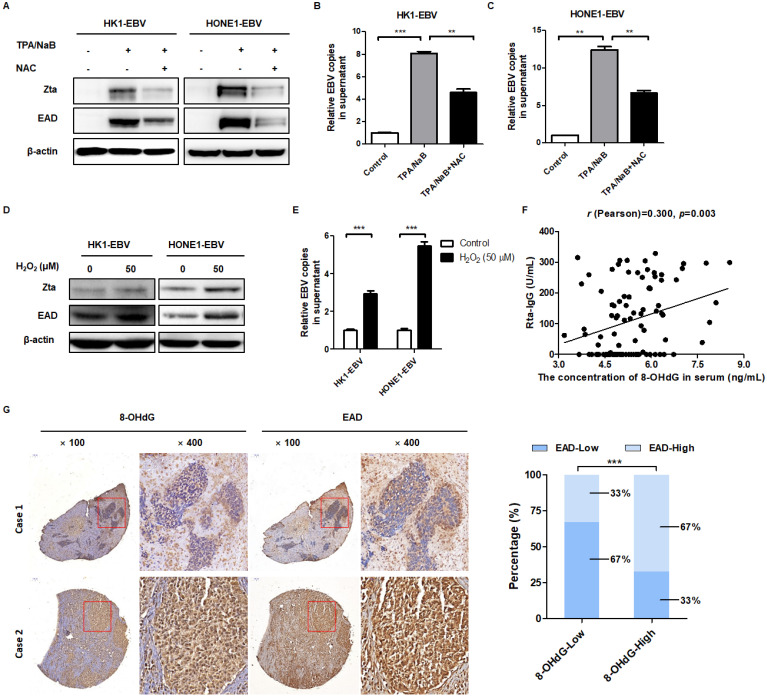
Figure 3.
EBV-induced high oxidative stress promotes its reactivation. (A) Cells were treated with NAC (5 mM) for 1 h and followed by TPA/NaB induction. The EBV lytic marker Zta and EAD protein expression were detected by western blot and β-actin was used as an internal control. (B-C) The viral genomes of EBV positive cells after treatment were detected by using EBV fluorescence quantitative PCR diagnostic kit. Data are shown as means ± S.D.; n = 3; **p < 0.01, ***p < 0.001. (D-E) Cells were treated with H2O2 (50 µM) for 24 h, the protein expression and viral genomes of EBV-positive cells after treatment were detected using the same methods as described before. Data are shown as means ± S.D.; n = 3; ***p < 0.001. (F) Serum Rta-IgG and 8-OHdG concentrations in the serum of NPC patients (n = 95) were assessed using the ELISA method. The correlation between 8-OHdG and Rta-IgG is shown by scatter plot; r (Pearson) = 0.300, p = 0.003. (G) (left) Representative IHC photographs showing the expression of 8-OHdG and EAD in consecutive sections of NPC microarrays (NPC 1501 and NPC 1502, Richmond, CA). (right) EAD level is calculated based on 8-OHdG expression in NPC microarrays (***p < 0.001).

