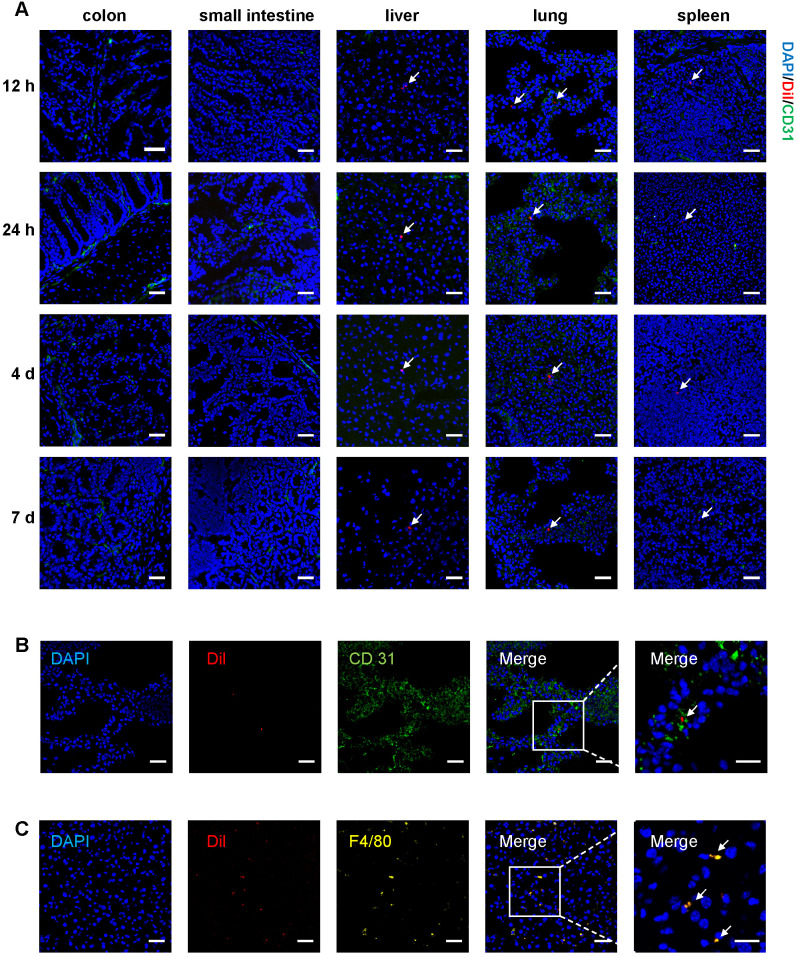
Figure 2.
In vivo tracking of Dil-labeled T-MSC. A. Mice were fed with 2.5% DSS for 3 days, and Dil-labeled T-MSCs were injected intravenously. In vivo distribution of T-MSCs was observed by immunofluorescence staining of the colon, small intestine, liver, lung, and spleen. Scale bar = 50 µm B. Immunofluorescence staining of the vascular endothelial cell marker CD 31 in frozen lung sections. Scale bar = 50 µm (left panel)/20 µm (right panel, magnified view). C. Immunofluorescence staining of the macrophage marker F4/80 in frozen sections of the liver. Scale bar = 50 µm (left panel)/20 µm (right panel, magnified view). Arrows indicate labeled cell components.

