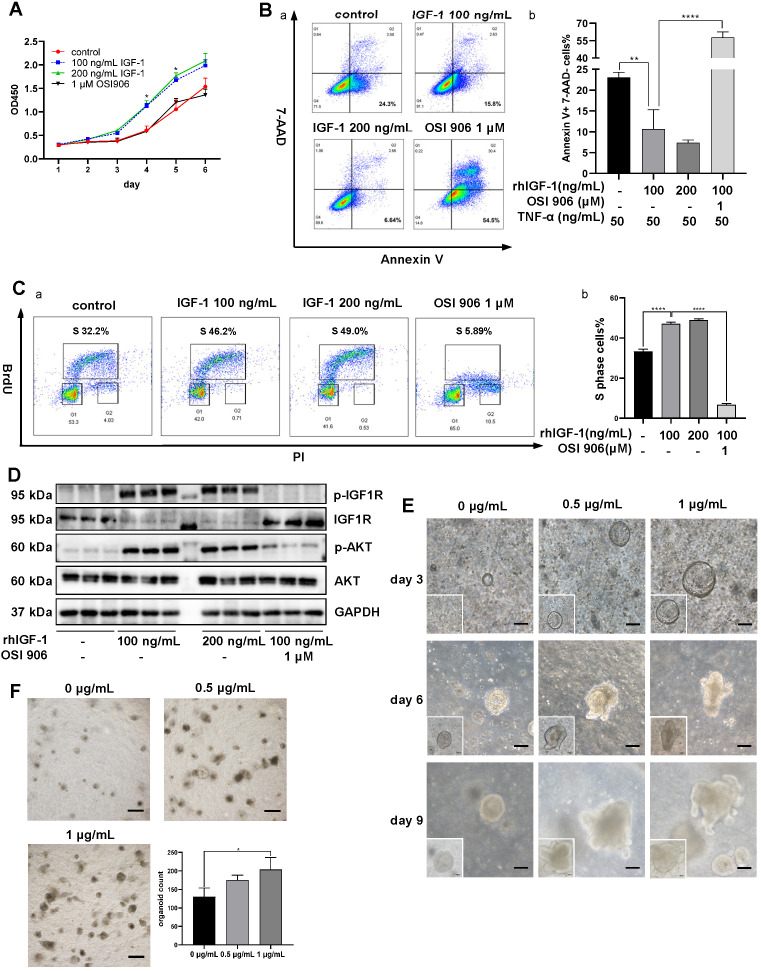
Figure 7.
Effects of in vitro IGF-1 stimulation on colon cells and organoids. A. The proliferation of NCM 460 cells was measured by the CCK-8 assay. OD450 values were observed for 6 days. rhIGF-1 stimulation (100 ng/mL, 200 ng/mL) increased OD 450 values on day 4 and day 5. B. Apoptosis of NCM 460 cells was induced by 50 ng/mL TNF-α in culture media. Flow cytometry analysis of Annexin V and 7-AAD staining showed rhIGF-1 stimulation (100 ng/mL, 200 ng/mL) decreased the percentage of Annexin V+, 7-AAD- early apoptotic cells. C. Flow cytometry analysis of BrdU and PI staining was used to measure the cell cycle. rhIGF-1 stimulation (100 ng/mL, 200 ng/mL) increased BrdU+ S phase cell percentage compared with controls. D. Protein expressions of downstream IGF1-IGF1R pathway in NCM 460 cells were measured by Western blotting. rhIGF-1 stimulation increased the phosphorylation of AKT and IGF-1 receptors. E. Mice colon crypts were isolated for organoid culture and rmIGF-1 (0.5 µg/mL, 1 µg/mL) was added daily from day 3 (the time point when colon organoids began to appear and grow). In vitro IGF-1 stimulation increased the growth speed and led to a larger size and more buddings of the organoids. Scale bar = 100 µm F. Colon organoids were harvested and counted on day 10. rmIGF-1 stimulation increased total organoid numbers. Scale bar = 500 µm. Data are expressed as mean ± SD. *p < 0.05, **p < 0.01 and ****p < 0.0001. rhIGF-1: recombinant human IGF-1; rmIGF-1: recombinant mouse IGF-1.

