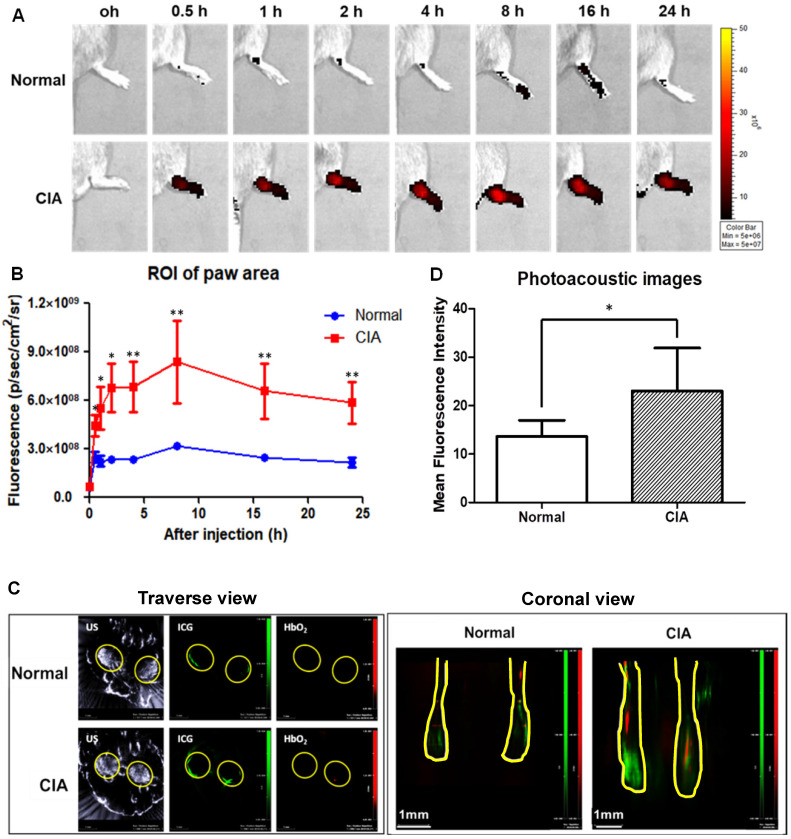
Figure 8.
Effect of targeted delivery of A-nanoceria in normal and CIA murine models (N = 3). (A) IVIS images at different time point (0.5, 1, 2, 4, 8 , 16, 24 h) of ICG signal (red) after intravenous (IV) injection of A-nanoceria-ICG (50 µL) to the paws (yellow circle); (B) summarized plot of ICG signal in ROI (5 hind paws per a group) after IV injection of A-nanoceria-ICG into normal (blue trace line) and CIA (red trace line) mice built from (A); (C) MSOT traverse and coronal views of paws after IV injection of A-nanoceria-ICG (grey: ultrasound, green: ICG, red: oxygenated hemoglobin (HbO2)). Yellow circles and lines represent the paws of normal and CIA animals. (D) MFI signal of ICG plotted from 6 different spots from each image of MSOT images (p-value: *p < 0.05, **p < 0.005 compared with Normal). Both imaging modes, IVIS and MSOT, confirmed the high retention of A-nanoceria within inflamed zones.

