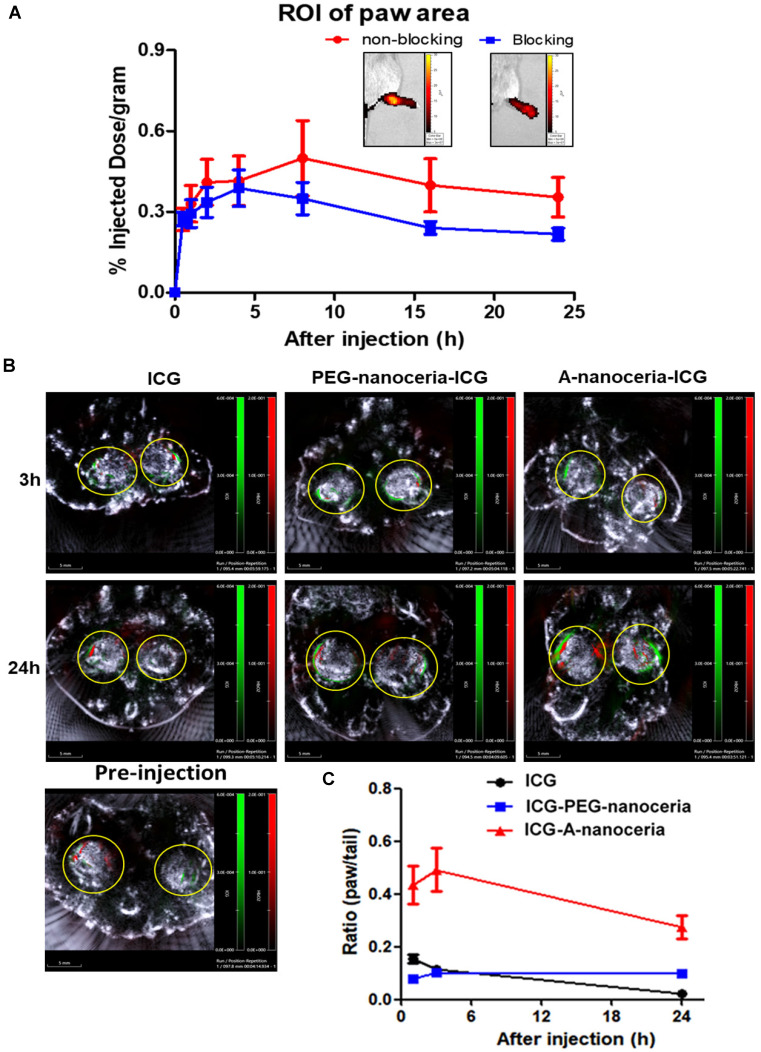
Figure 9.
Evaluation of targeting efficiency of A-nanoceria. (A) Confirmation of SPARC-associated mechanism of A-nanoceria uptake and its accumulation within inflamed zones using IVIS. A-nanoceria uptake was inhibited by blocking SPARC using anti-SPARC antibody (50 µg by IP injection with precursor A-nanoceria); the insets: IVIS images of the hind paws of CIA animals treated with A-nanoceria (non-blocking) and anti-SPARC+A-nanoceria (blocking). (N = 3 mice per group, 5 hind paws per each; error bars = SEM). (B) Distribution of ICG, A-nanoceria-ICG and PEG-nanoceria-ICG over time by MSOT. The images (scale bar is 5 mm) represent the overlay of three signals (grey: ultrasound, red: HbO2, green: ICG) in the animal paws before and after (3, 24 h) tail vein injection of ICG (50 µL), A-nanoceria-ICG (50 µL), or PEG-nanoceria-ICG (50 µL) at equal amount of ICG injected per a treatment (concentrations and injection volume). Yellow circles represent the cross-section of the hind paws. Intensive ICG signal can be notified around HbO2 signal in the A-nanoceria-ICG treated animal paw. (C) Summarized plot of ICG signal distribution in the ROI of the paws and the tail (ratio between paw and tail) from IVIS imaging data (Figure S7). ICG signal distribution in the paws and the tail from ICG-PEG-nanoceria is included as a control group (N = 3, error bars = SEM).

