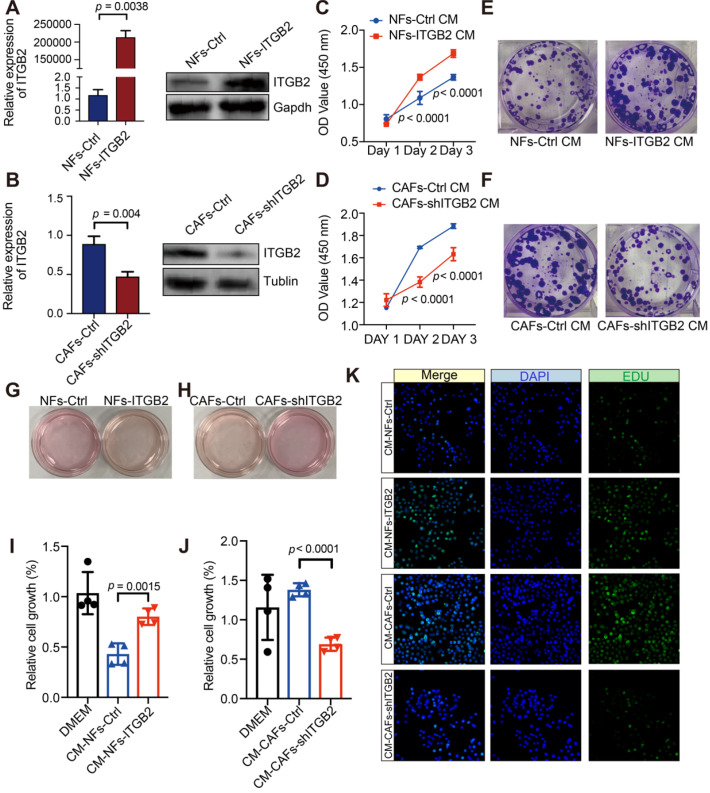
Figure 3.
ITGB2-expressing CAFs promote OSCC proliferation not via cytokines. A) Relative expression of ITGB2 between NFs-Ctrl and NFs-ITGB2 by RT-PCR (Left) and western blot (Right); B) Relative expression of ITGB2 between CAFs-Ctrl and CAFs-shITGB2 by RT-PCR (Left) and western blot (Right). C) Proliferation of HSC3 cell at indicated time after culturing in NFs-Ctrl or NFs-ITGB2 cultured medium. N=3. D) Proliferation of HSC3 cell at indicated time after culturing in CAFs-Ctrl or CAFs-shITGB2 cultured medium. N=3. E) Representative images of colonies formed in NFs-Ctrl and NFs-ITGB2 cultured medium. F) Representative images of colonies formed in CAFs-Ctrl and CAFs-shITGB2 cultured medium. G-H) Color of medium of NFs-Ctrl versus NFs-ITGB2 (G) and CAFs-Ctrl versus CAFs-shITGB2 (H). I) Proliferation of HSC3 cells at 24 hours post culturing in CM-NFs-Ctrl or CM-NFs-ITGB2. N=4. J) Proliferation of HSC3 cells at 24 hours post culturing in CM- CAFs-Ctrl or CM-CAFs-shITGB2. N=4. K) Representative immunofluorescence images of EdU (Green) incorporation into HSC3 at 24 hours post culturing in CM-NFs-Ctrl, CM-NFs-ITGB2, CM-CAFs-Ctrl or CM-CAFs-shITGB2. Individual p value was shown in each figure.

