Figure 4.
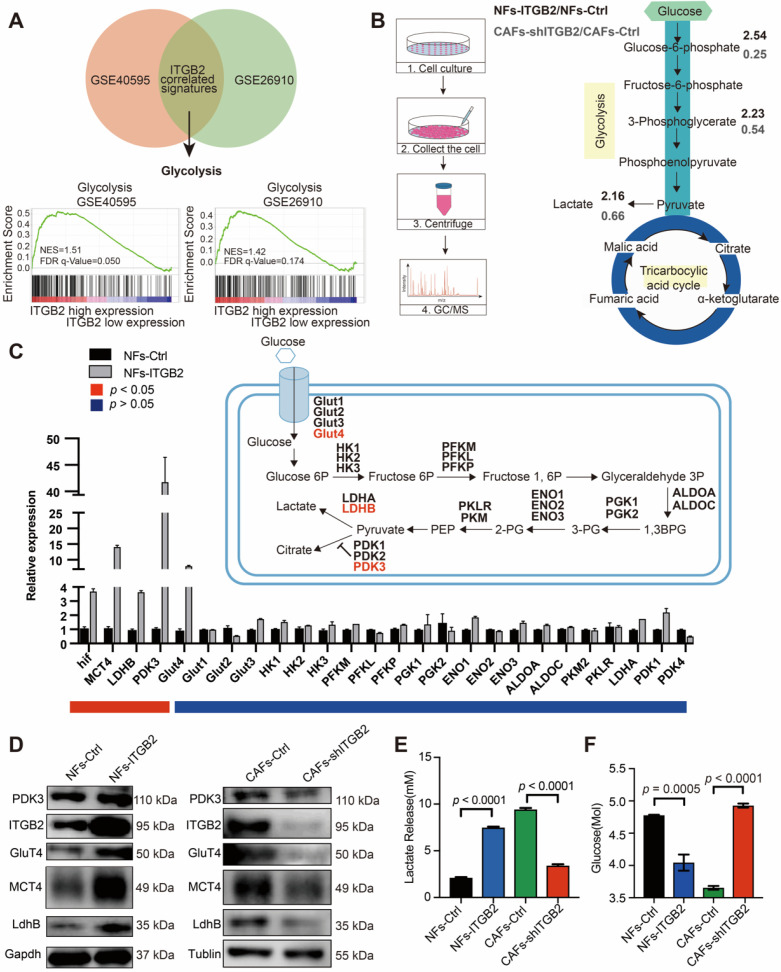
ITGB2 regulates glycolysis in CAFs. A) GSEA plot of the association between gene sets positively correlated with ITGB2 in the stroma profile of GSE40595 and GSE26910. B) Left: Cartoon describing the experimental setup for LC-MS analyses of NFs-Ctrl, NFs-ITGB2, CAFs-Ctrl, CAFs-shITGB2. Right: Graphical presentation of LC-MS results by flow diagram, showing glycolytic metabolite ratios between NFs-Ctrl versus NFs-ITGB2 (marked in bold black numbers) or CAFs-Ctrl versus CAFs-shITGB2 (marked in bold grey numbers). C) mRNA gene expression levels (relative to Gapdh) of the glycolytic enzymes in NFs-Ctrl and NFs-ITGB2. N=2. D) Western blot showing the proteins regulating glycolysis, gapdh and tublin between NFs-Ctrl versus NFs-ITGB2 (Left) and CAFs-Ctrl versus CAFs-shITGB2 (Right). E) Lactate levels in medium of NFs-Ctrl, NFs-ITGB2, CAFs-Ctrl and CAFs-shITGB2 at 24 hours. N=3. F) Glucose levels in medium of NFs-Ctrl, NFs-ITGB2, CAFs-Ctrl and CAFs-shITGB2. N=3. Individual p value was shown in each figure.

