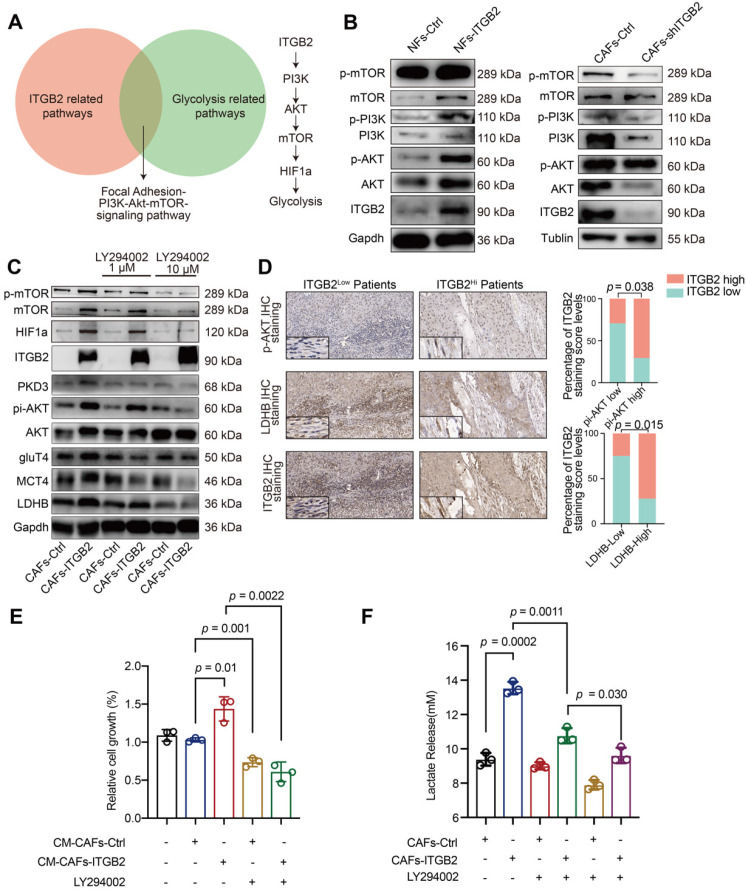
Figure 5.
ITGB2 regulates glycolysis via PI3K/AKT/mTOR pathways in CAFs. A) Venn diagram showing the overlap between ITGB2 related pathways and glycolysis related pathways (Left). Model depicting the pathways of glycolysis induction following ITGB2 upregulation in CAFs (Right). B) Western blot showing phosphorylated PI3K, AKT, mTOR, Gapdh and Tublin expression in NFs-Ctrl versus NFs-ITGB2 and CAFs-Ctrl versus CAFs-shITGB2. C) Western blot showing phosphorylated PI3K, AKT, mTOR and key glycolytic enzyme expression in CAFs-Ctrl and CAFs-ITGB2 after treated with 1 µM or 10 µM LY294002 for 24 hours. D) Representative images of phosphorylated AKT and LDHB expression in ITGB2-low and ITGB2-high CAFs patients (Left). Correlation between ITGB2 and phosphorylated AKT (Upper), LDHB (Down) expression levels in 34 clinical samples. N (ITGB2-low group) = 17, N (ITGB2-high group) = 17. E) Proliferation of HSC3 at 24 hours cultured in CM-CAFs-Ctrl or CM-CAFs-ITGB2 treated with or without LY294002. N=3. F) Lactate levels of the medium of CAFs-Ctrl or CAFs-ITGB2 treated with or without 1 µM or 10 µM LY294002. N=3. Individual p value was shown in each figure.

