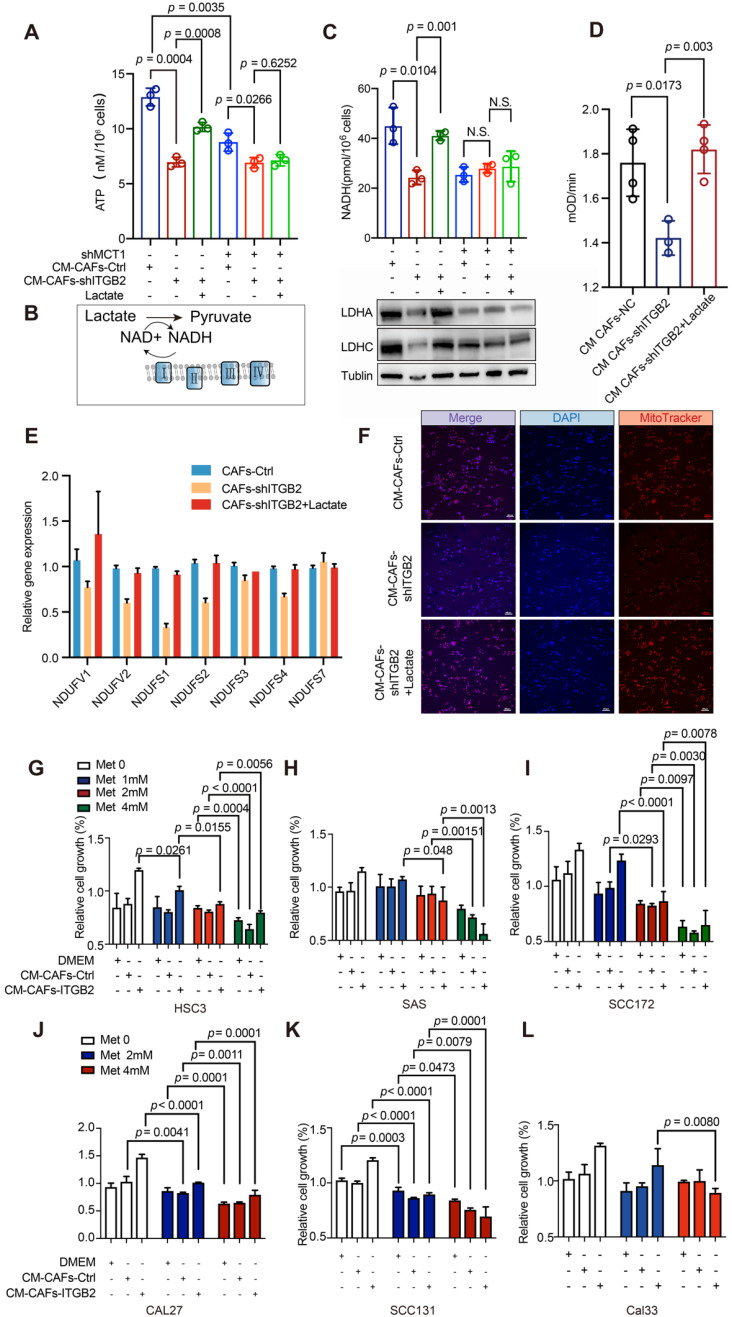
Figure 7.
ITGB2-expressing CAFs promotes OSCC proliferation via NADH generated from lactate oxidization. A) ATP levels of HSC3 or HSC3-shMCT1 cells at 24 hours cultured in CM-CAFs-Ctrl or CM-CAFs-shITGB2 with or without lactate. N=3. B) Graphical presentation of lactate oxidization pathway. C) Upper: NADH levels of HSC3 or HSC3-shMCT1 cells at 24 hours cultured in CM-CAFs-Ctrl or CM-CAFs-shITGB2 with or without lactate. N=3. Down: Western blot showing LDHA, LDHC and Tublin expression of HSC3 or HSC3-shMCT1 cell lysates at 24 hours cultured in CM-CAFs-Ctrl or CM-CAFs-shITGB2 with or without lactate. D) Analyses of mitochondrial complex I activity of HSC3 cells cultured in CM-CAFs-Ctrl or CM-CAFs-shITGB2 with or without lactate. N=4. E) mRNA expression levels (relative to Gapdh) of the genes encoding mitochondrial complex I in HSC3 cells cultured in CM-CAFs-Ctrl, CM-CAFs-shITGB2 or CM-CAFs-shITGB2 plus lactate. N=3. F) Representative immunofluorescence images of mitochondrial mass (MitoTracker) of HSC3 cells at 24 hours cultured in CM-CAFs-Ctrl or CM-CAFs-shITGB2 with or without lactate. G-L) Relative cell growth of HSC3 cells (G), SAS cells (H), SCC172 (I), CAL27 (J), SCC131 (K) and CAL33 (L) cultured in CM-CAFs-Ctrl or CM-CAFs-shITGB2 with or without lactate. N=3. Individual p value was shown in each figure.

