Figure 1.
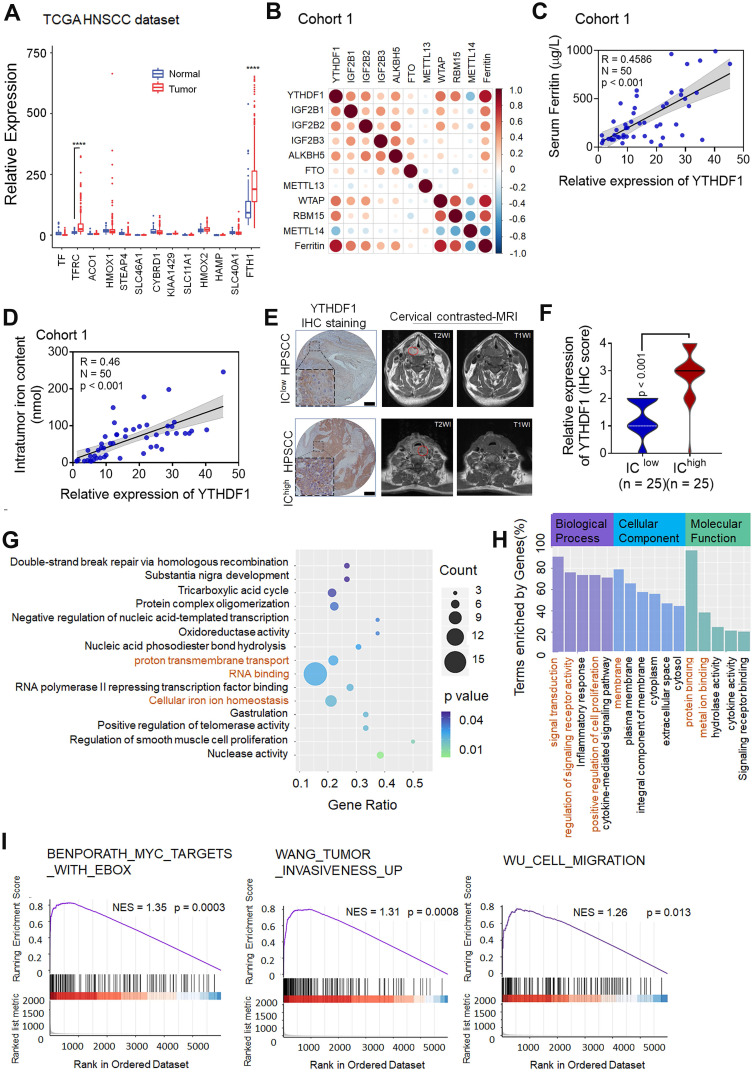
YTHDF1 is closely correlated with iron metabolism in HPSCC cells. (A) The results of iron regulatory gene expression assessments determined by RNA-seq with TCGA data are shown. *p < 0.05; **p < 0.01; ***p < 0.001; ***p < 0.0001. (B) The correlation matrix shows the relationship between the expression of m6A-modified genes and serum ferritin levels in 50 HPSCC patients in cohort 1. The expression of m6A- modified genes was detected by quantitative real-time PCR (qPCR). (C) Correlation between YTHDF1 expression and serum ferritin level in 50 HPSCC patients from cohort 1. YTHDF1 expression was detected by qPCR. (D) Correlation between YTHDF1 expression and intratumoral iron content (nmol) in 50 HPSCC patients from cohort 1. YTHDF1 expression was detected by qPCR. (E) Representative cervical contrast MR images and YTHDF1 IHC images of samples from HPSCC patients with high and low intratumoral iron concentrations (ICs) in cohort 1. Representative T1- and T2-weighted (WI) cervical MR images of patients with different levels of iron overload. Scale bar = 100 µm (10×, 40×). (F) Statistical analysis of the relative expression of YTHDF1 (IHC score) in HPSCC patients with high and low ICs based on unpaired Student's t-tests. (G-H) Gene Ontology (GO) (G) and Kyoto Encyclopedia of Genes and Genomes (KEGG) (H) analyses of 860 significantly enriched upregulated genes and 889 significantly enriched downregulated genes as identified by RNA-seq. (I) GSEA plots showing the pathways of differentially expressed genes altered by YTHDF1 and involved in HPSCC.

