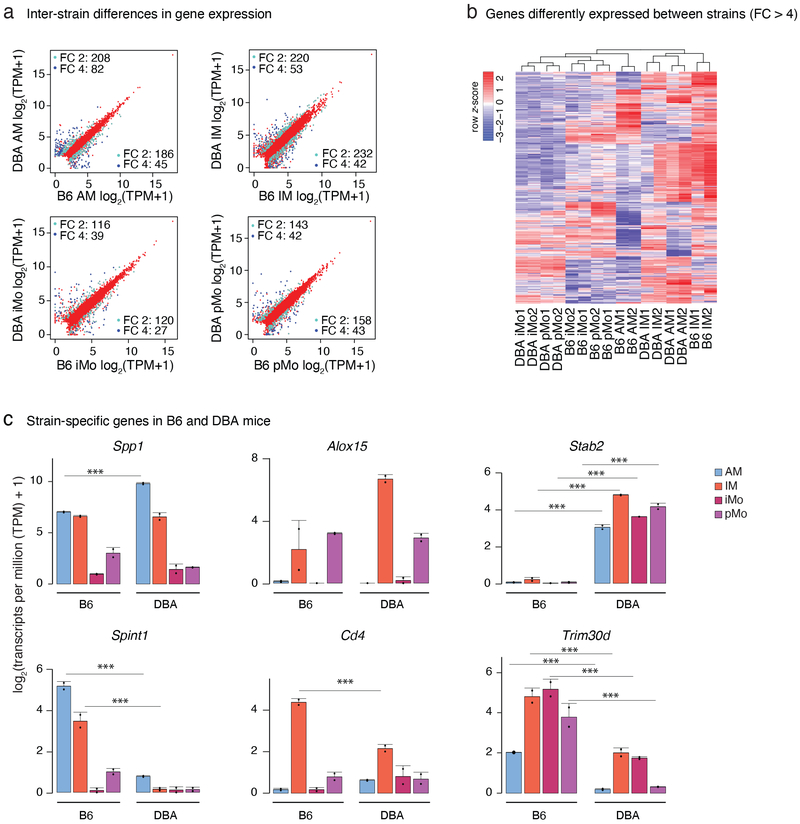
Figure 2: Strain-specific transcriptomes of lung mononuclear phagocytes (MPs) at baseline.
a. Comparison of gene expression in B6 and DBA mice for each lung MP subset. Scatter plots are showing genes with transcripts per million (TPM) > 4. Pale blue dots show genes with fold change (FC) 2 or higher, dark blue dots show genes with FC 4 or higher. N=2 for each cell type in both strains.
b. Inter-cellular and inter-strain comparison of highly differentially expressed genes. Heat map shows unsupervised hierarchical clustering of genes with FC 4 or higher between the strains. Values are row z-score.
c. Examples of strain specific genes included in the heat map in Fig. 2b. Bar graphs represent mean log2 transcripts per million (TPM+1) ± SD, N=2. Asterisks indicate statistical significance, * p-adj < 0.05, ** p-adj < 0.01, *** p-adj < 0.001 calculated by DESeq2 and multiple-testing corrected with Benjamini-Hochberg.

