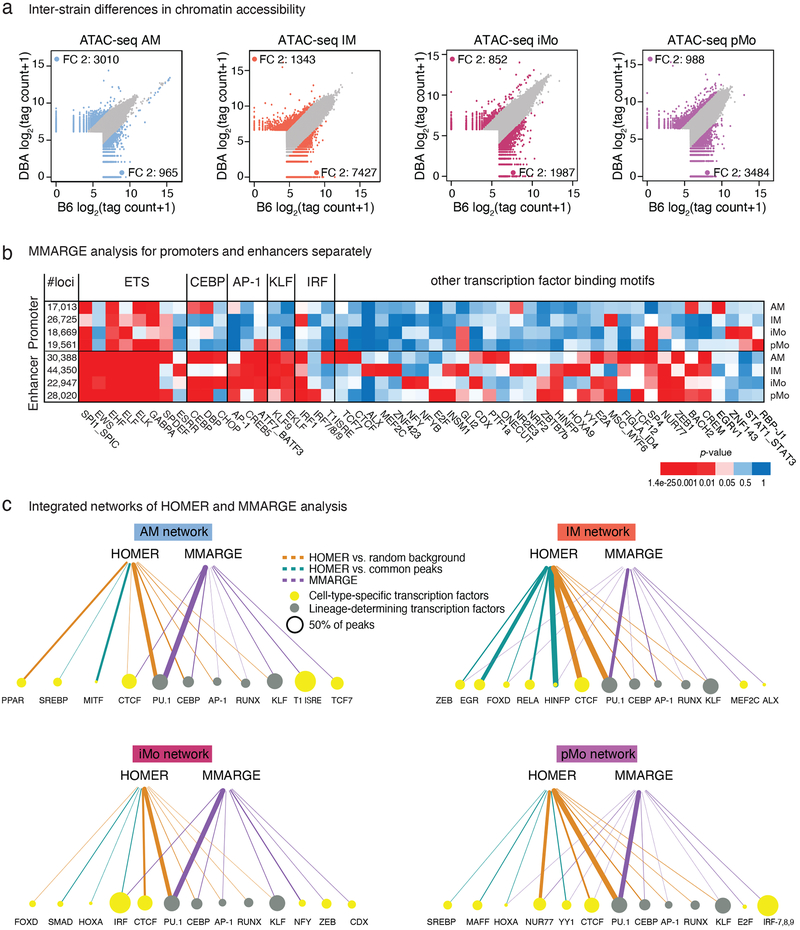
Figure 4: Effects of natural genetic variation on lung mononuclear phagocyte (MP) open chromatin.
a. Inter-strain comparison of ATAC-seq peak tag counts for the four lung MP subsets. Scatter plots are showing log2 tag counts of ATAC-seq peaks, colored dots show ATAC-seq peaks with fold change (FC) 2 or higher (blue for AM, orange for IM, bordeaux for iMo and purple for pMo).
b. MMARGE analysis of lung MP. Distribution of chromatin accessibility was calculated for all peaks missing a motif in either B6 or DBA mice. Student’s t-test was used to test for significant differences between these two distributions. Heatmap showing p-values for all significant motifs in enhancers (> 3kb away from TSS) and promoters (< 3kb away from TSS). N=2 for each cell type in both strains.
c. Integrated network of HOMER and MMARGE analysis results for each lung MP subset. Node sizes are proportional to the percentage of peaks containing the motif. Lineage-determining transcription factors (TF) are represented with green nodes, other TF with yellow nodes. Edges are proportional to p-values. Edge color represents the analysis method; brown for HOMER with GC matched random background, turquoise for HOMER with common peaks as background, purple for MMARGE.

