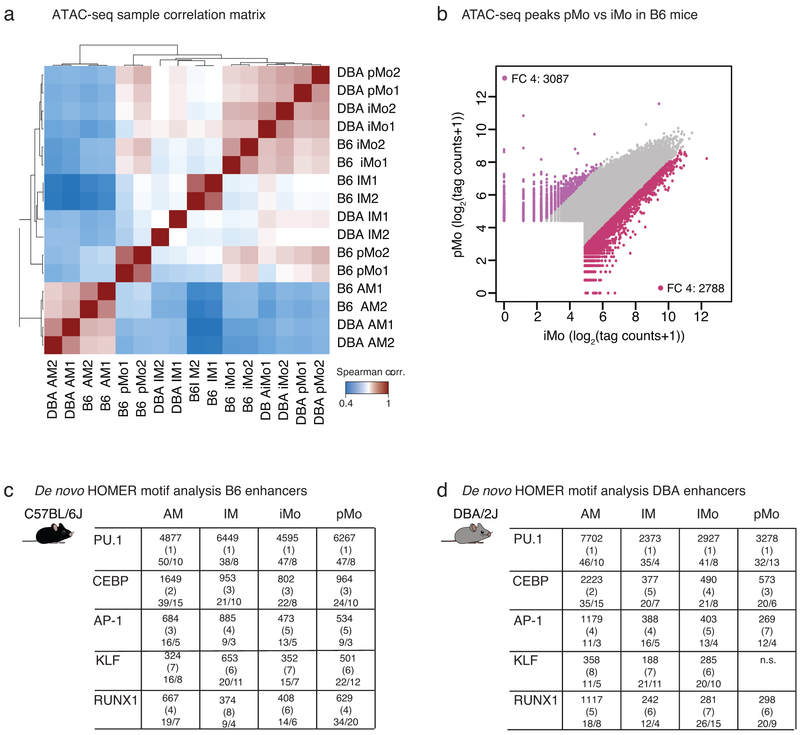
Extended Data Fig. 2. ATAC-seq quality control and HOMER de novo motif analysis.
a. Spearman correlation heat map of all ATAC-seq replicates, N=2 for each cell type in both mouse strains.
b. Comparison of open chromatin regions for iMo vs pMo in B6 mice. Scatter plot shows log2 tag counts of ATAC-seq peaks, colored dots show ATAC-seq peaks with fold change (FC) 4 or higher, bordeaux for iMo and purple for pMo.
c. HOMER de novo motif enrichment analysis for transcription factor (TF) binding sites in distal regions of open chromatin (> 3 kb from a TSS) likely representing enhancers using GC matched background for B6 mice. Boxes display −log10 p-values for enrichment of the motif, rank order in parenthesis and percentage of motif occurrence in peaks vs background, N=2 for each cell type in both mouse strains.
d. HOMER de novo motif enrichment analysis for TF binding sites in distal regions of open chromatin (> 3 kb from a TSS) likely representing enhancers using GC matched background for DBA mice. Boxes display −log10 p-values for enrichment of the motif, rank order in parenthesis and percentage of motif occurrence in peaks vs background, N=2 for each cell type in both mouse strains.

