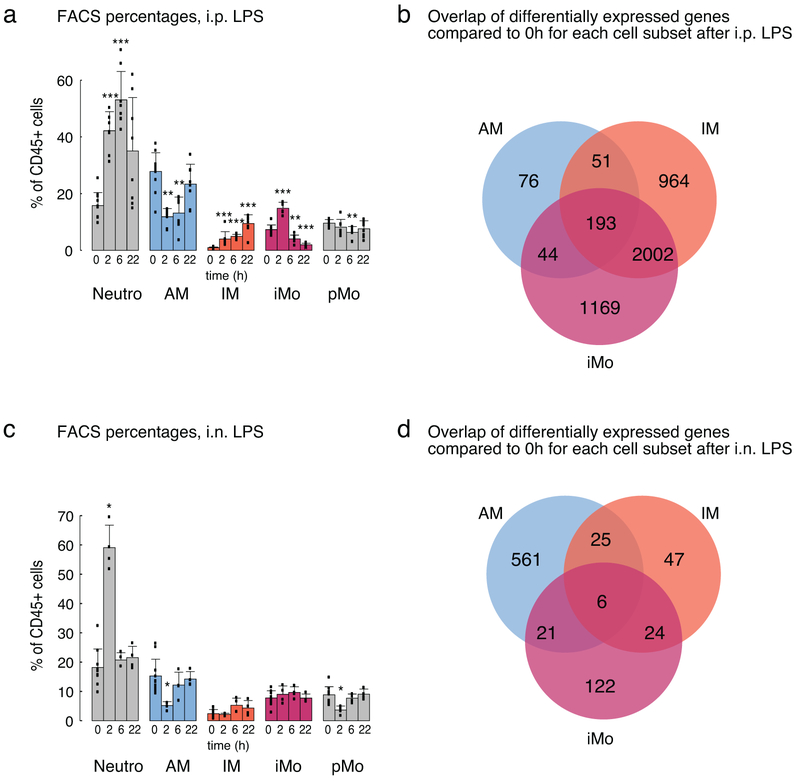
Extended Data Fig. 3. Flow cytometry and ingenuity pathway analysis (IPA) of lung mononuclear phagocytes (MPs) after LPS administration.
a. Flow cytometry analysis of lung MP subsets and neutrophils after i.p. LPS administration. Bars represent the average percentage of given cell subset out of CD45+ leukocytes ± SD. Three independent experiments were pooled, 0h N=11, for all other time points N=8. Non-parametric Wilcoxon signed-rank test with Bonferroni correction was used, * p < 0.05, ** p < 0.01, *** p < 0.001.
b. Venn diagram of 4,499 differentially expressed genes in AM, IM and iMo after i.p. LPS administration.
c. Flow cytometry analysis of lung MP subsets and neutrophils after i.n. LPS administration. Bars represent the average percentage of given cell subset out of CD45+ leukocytes ± SD. Two independent experiments were pooled, 0h N= 11, for all other time points N=4. Non-parametric Wilcoxon signed-rank test with Bonferroni correction was used, * p < 0.05, ** p < 0.01, *** p < 0.001.
d. Venn diagram of 806 differentially expressed genes in AM, IM and iMo after i.n. LPS administration.

