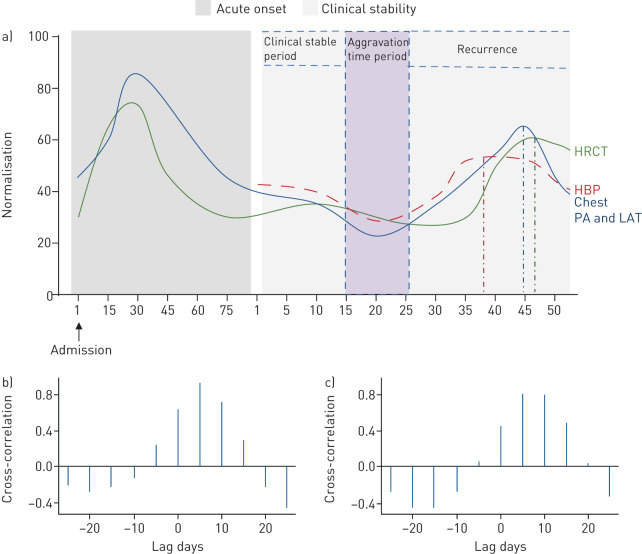
FIGURE 2.
Comparison between the trends of high-resolution computed tomography (HRCT) and chest posteroanterior oblique (PA) and lateral (LAT) views in critically ill coronavirus disease 2019 patients. a) The y-axis is the percentage of lung area with exudative lesions in HRCT and chest PA and LAT. The figure shows the time when the three indicators peak. The time line was from the start of admission to the end of the study for a total of 125 days. b) Cross-correlation function (CCF) analysis between HRCT and heparin-binding protein (HBP). The correlation of HRCT and HBP is highest with a 5-day lag for HRCT (r=0.92, p<0.05). c) CCF analysis between chest PA and LAT and HBP. The correlation between chest PA and LAT and HBP is highest at 5 days (r=0.804, p<0.05).

