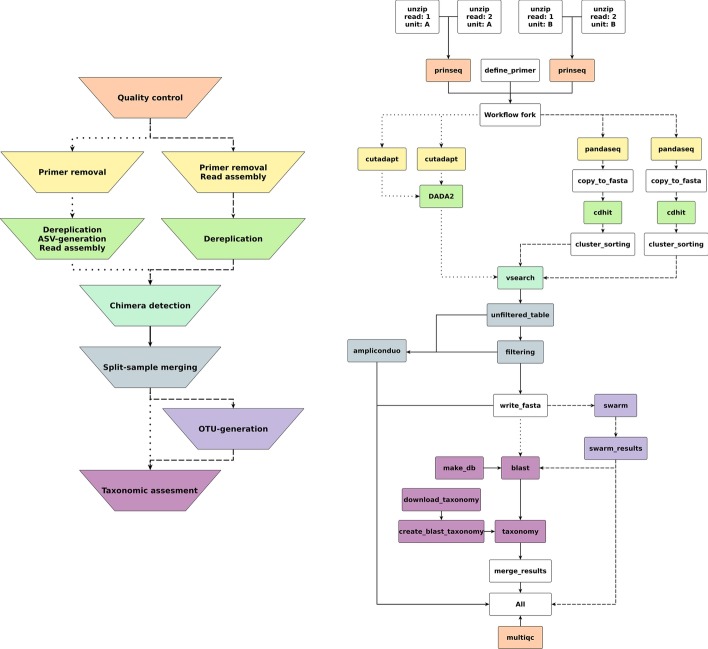
Fig. 1.
Left: schematic representation of the main steps of the workflow; the color coding represents which rules belong to which main step. Dotted edges denote the ordering of steps taken for the ASV variation of the workflow, dashed lines denote the ordering of steps taken by the OTU variation of the workflow, and straight lines are the steps that are identical in both versions. Right: Graph of an example workflow. Each node represents a rule instance to be executed. The direction of each edge represents the order in which the rules are executed. Disjoint paths in the graph can be executed in parallel

