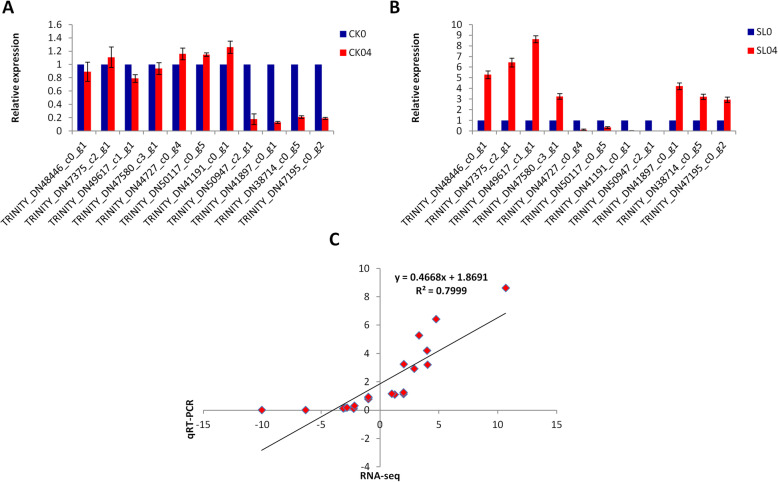
Fig. 5.
qRT-PCR validation of selected candidate genes. a non-inoculated plants, b inoculated plants. The x-axis represents the genes while the y-axis represents the relative expression of each gene. The bars show standard deviation. c Pearson correlation between qRT-PCR and RNA-seq data. SL0, SL04, CK0 and CK04 represent the Suillus luteus (SL) inoculated plants without Al stress application, SL inoculated plants with 0.4 mmol L− 1 Al stress application, plants non-inoculated without Al stress application and plants non-inoculated with 0.4 mmol L− 1 Al stress application, respectively

