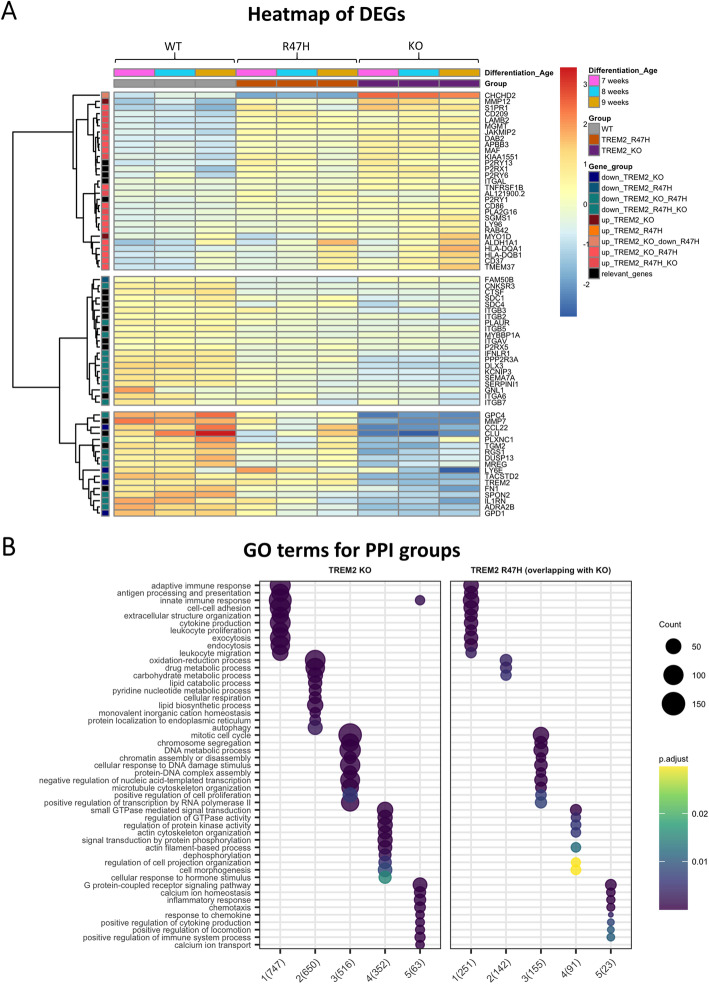
Fig. 5.
Top DEGs of R47H TREM2 and TREM2 KO pMac overlap; furthermore, the R47H DEGs that are shared with TREM2 KO represent numerous biological processes, distributed between five protein-protein interaction (PPI) modules. a Heatmap of top upregulated and top downregulated DEGs for R47H TREM2 and TREM2 KO, with the relative expression for each gene represented by colours on the corresponding row. A selection of “relevant genes” was also included. Unbiased clustering (dendrogram on the left) shows that genes separate into two major clusters based on whether they are upregulated or downregulated in TREM2 KO or R47H TREM2, and there is no genotype-specific segregation. b Five modules of functionally related DEGs identified by PPI network analysis of TREM2 KO DEGs, with enriched gene ontology (GO) terms shown. R47H DEGs were only included where they were also differentially expressed in TREM2 KO and were overlaid onto clusters identified using TREM2 KO data. Clusters identified numerically on the x-axis, with TREM2 KO on the left and R47H TREM2 on the right, showing a similar pattern of dysregulated cell functions. Number of DEGs represented by circle size, and p value represented by colour

