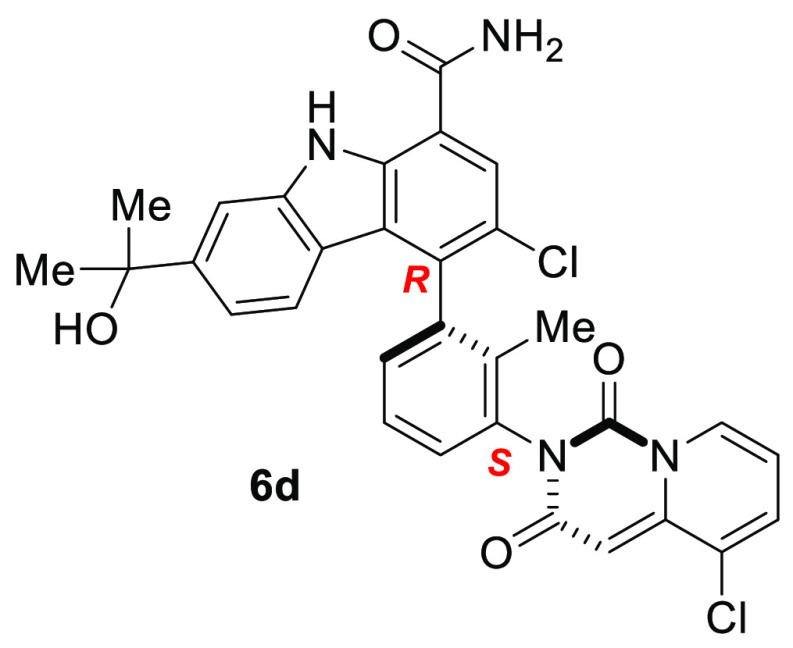
Table 3. Partial In Vitro Cell Activity Data and Whole Blood Data for 6d.
| IC50 (nM)a |
|||
|---|---|---|---|
| assay | receptor/stimulation | 6d | 1 |
| cellular assays | |||
| calcium flux in Ramos B Cells | BCR/anti-IgM | 7 ± 3 | 26 ± 15 |
| proliferation of human peripheral B Cells | BCR/anti-IgM/IgG | 1 ± 0.4 | 8b |
| CD86 surface expression in peripheral B Cells | BCR/anti-IgM/IgG | 1 ± 0.5 | 40 ± 30 |
| CD86 surface expression in peripheral B Cells | CD40/CD40L | >10 000 | >10 000 |
| TNFα from human PBMC Cells | FCλR/immune complex | 2b | 14b |
| human whole blood assays | |||
| human whole blood CD69 surface expression in peripheral B Cells | BCR/anti-IgM | 25 ± 10 | 550 ± 100 |
| mouse whole blood CD69 surface expression in peripheral B Cells | BCR/anti-IgM/IgG | 130 | 2,100 ± 200 |
| human whole blood CD63 surface expression in basophils | FceRI/anti-IgE | 54 ± 20 | ND |
IC50 values are shown as mean values of at least three determinations.
IC50 values are shown as a single determination; PBMC = peripheral blood mononuclear cells; ND = not determined.

