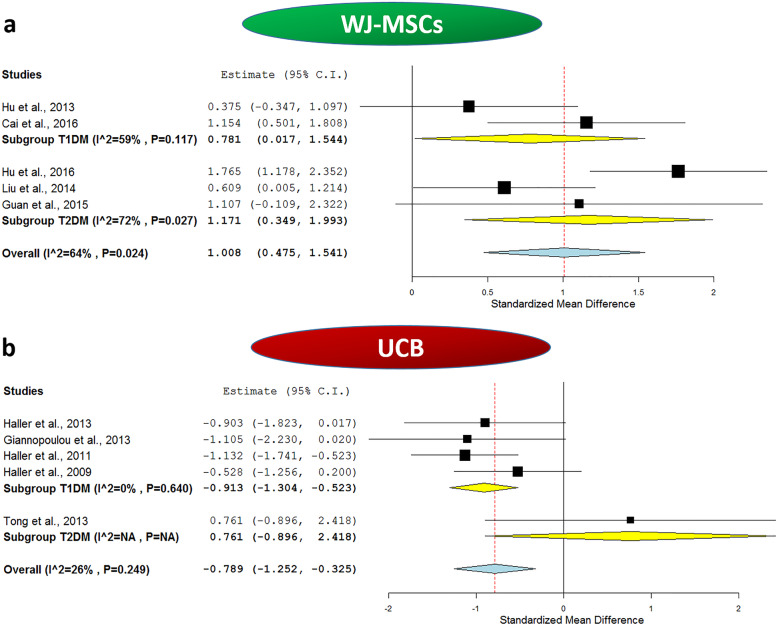
Fig. 3.
Forest plots showing C-peptide levels before and after application of umbilical cord-derived stem cell transplantation. a Comparison of C-peptide levels at baseline and after WJ-MSCs intervention in both T1DM and T2DM and b comparison of C-peptide levels at baseline and after UCB intervention in both T1DM and T2DM. The random-effects meta-analysis model (Der Simonian−Laird method) was used. The ends of the horizontal bars denote a 95% CI. The diamond gives the overall standardized mean difference (pooled estimate) for the combined results of all included trials

