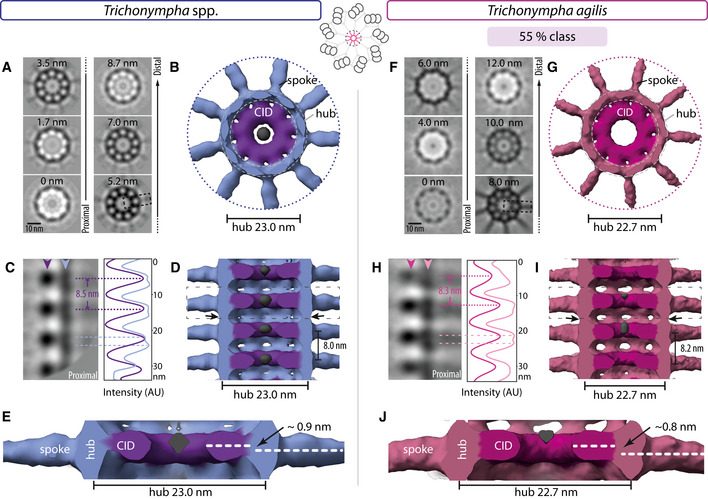
Transverse 2D slices through T. spp. central cartwheel STA at indicated height from proximal (0 nm) to distal (8.7 nm). The dashed box indicates corresponding region shown in (C). Schematic on top center illustrates the area used to generate the 3D maps of the central cartwheel.
Transverse view of T. spp. central cartwheel STA 3D map; 9 spoke densities emanate from the hub, and the CID is present within the hub. The diameter of the hub is 23.0 ± 0 nm (N = 3; here and thereafter in the figure legends, N corresponds to 2D measurements from STA). An electron‐dense structure is present inside the CID (gray), which is also visible to some extent before symmetrizing. Note that the coloring of elements in this and other figure panels is merely illustrative and not meant to reflect underlying molecular boundaries.
2D longitudinal view of T. spp. central cartwheel STA delineated by a dashed box in (A). Arrowheads denote position of line scans along the vertical axis at the level of the CID (purple) and hub (blue), with corresponding pixel intensities in arbitrary units (AU). Plot profiles are shifted horizontally relative to each other for better visibility. Some maxima are highlighted with dashed lines; the average distance between two CID elements is 8.5 ± 0.2 nm (N = 4). Note that hub densities are elongated in the vertical direction, resulting in broad peak profiles where two maxima can be discerned (dashed blue lines).
Longitudinal view of T. spp. central cartwheel STA. The average distance between emanating spokes is 8.0 ± 1.5 nm (N = 2); these are measurements on STA and are within the error of the CID periodicities reported in (C); the same applies for other measurements hereafter. Discontinuous densities in the center of the CID (gray) are visible, as well as densities that vertically bridge successive hub elements (arrows). The dashed box is shown magnified in (E). Proximal is down in this and all other figure panels showing STA longitudinal views.
The CID axis is located distal relative to the axis of spoke densities, corresponding to an average shift of 0.9 ± 0.7 nm (N = 3).
Transverse 2D slice through T. agilis central cartwheel STA at indicated height from proximal (0 nm) to distal (12 nm). The dashed box indicates corresponding region shown in (H).
Transverse view of T. agilis central cartwheel STA 3D map; 9 spoke densities emanate from the hub, and the CID is present within the hub, which has a diameter of 22.7 ± 0.2 nm (N = 3).
2D longitudinal view of T. agilis central cartwheel STA delineated by a dashed box in (F). Arrowheads denote position of line scans along the vertical axis at the level of the CID (dark pink) and hub (light pink), with corresponding pixel intensities in arbitrary units (AU). Plot profiles are shifted horizontally relative to each other for better visibility. Some maxima are highlighted with dashed lines; the average distance between two CID elements is 8.3 ± 0.5 nm (N = 9). Note that hub densities are elongated in the vertical direction, resulting in broad peak profiles where two maxima can be discerned (dashed light pink lines).
Longitudinal view of T. agilis central cartwheel STA. The average distance between emanating spokes is 8.2 ± 0.5 nm (N = 9). Discontinuous densities in the center of the CID (gray) are visible at this lower contour level compared to (G). Note densities vertically bridging successive hub elements (arrows). Boxed area is shown magnified in (J).
The CID axis is located distal relative to the axis of spoke densities, corresponding to an average shift of 0.8 ± 0.3 nm (N = 9).

