-
A
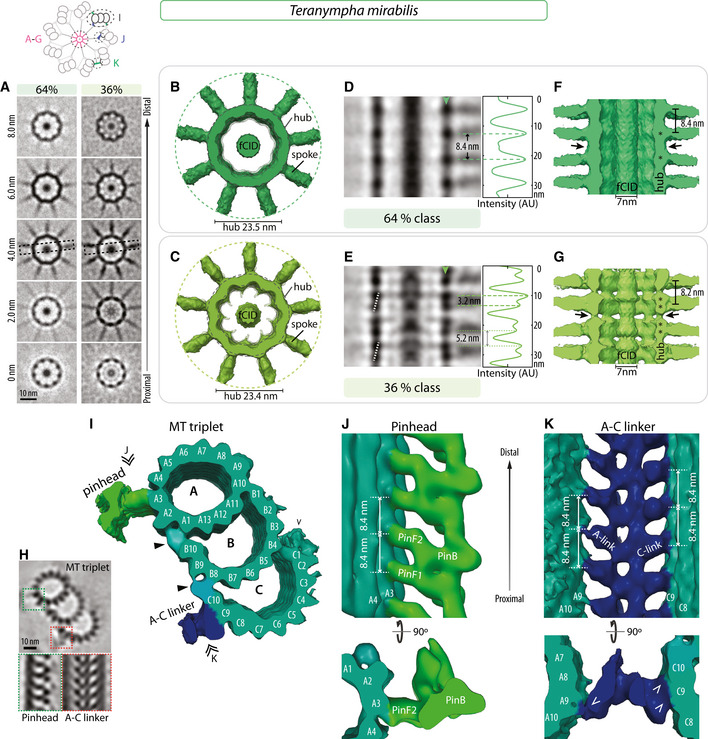
Transverse 2D slices through STA comprising 64 and 36% of sub‐volumes of T. mirabilis central cartwheel at indicated height from proximal (0 nm) to distal (8.0 nm). The dashed boxes in the 4.0 nm slices indicate regions shown in (D and E). Note filamentous cartwheel inner densities (fCID) in the center of the hub. Schematic on top illustrates the different areas used to generate 3D maps of the central cartwheel (A‐G), MT triplets (I), pinhead (J), and A‐C linker (K).
-
B, C
Transverse view of T. mirabilis central cartwheel STA of 64% (B) and 36% (C) classes, with corresponding hub diameters of 23.5 ± 0.2 nm and 23.4 ± 0.5 nm (both N = 3). In both classes, the fCID is visible and 9 spokes emanate from the hub.
-
D, E
2D longitudinal view of T. mirabilis central region of the cartwheel STA 64% (D) and 36% (E) classes in the region delineated by dashed boxes in (A). Arrowheads denote position of line scans along vertical axis at the hub level, with corresponding normalized pixel intensities (in arbitrary units). Some maxima are highlighted by dashed lines. The average distance between hub units in the 64% class is 8.4 ± 0.6 nm (N = 8; D); in the 36% class, the distance between hub densities alternates between 3.2 ± 0.3 nm and 5.2 ± 0.3 nm and (both N = 9; E). Dashed white line in (E) indicates the offset between two superimposed hub units at the level of spoke densities, which occurs every other hub unit pair.
-
F, G
Longitudinal view of T. mirabilis cartwheel STA 64% (F) and 36% (G) classes. The average distance between spokes is 8.4 ± 0.6 nm (N = 8) in the 64% class and 8.2 ± 1.5 nm (N = 7) in the 36% class. Note in both cases the continuous fCID with ~7 nm in diameter inside the hub. Note also densities bridging successive hubs vertically (arrows). Asterisks denote positions of individual units apparent within hub densities. Note that the fCID was not always positioned in the geometrical center of the hub, suggestive of inherent flexibility.
-
H
(Top) 2D slice through STA transverse view of microtubule triplet in T. mirabilis, with insets showing pinhead (dashed green box) and A‐C linker (dashed red box). (Bottom) Longitudinal 2D slice of STA centered on the pinhead (left) or A‐C linker (right).
-
I
Transverse view of microtubule triplet STA in T. mirabilis. Microtubule protofilaments are indicated, as are the positions of the pinhead and the C‐link (the A‐link lies on the edge of the volume and is thus less well resolved in this STA—for better views, see STA centered on A‐C linker in panel K). At this contour level, MIPs are not visible. Arrowheads indicate external densities at the A‐B and B‐C inner junctions; chevron indicates C‐stretch. Double arrowheads point to viewing directions shown in (J, K).
-
J
Longitudinal view of T. mirabilis STA centered on the pinhead, from the viewing point indicated in (I). Location of pinhead consisting of pinfeet (PinF1 and PinF2) and pinbody (PinB) are indicated, as are microtubule protofilaments A3/A4. The average distance between pinfeet elements is 8.4 ± 0.5 nm in each case (both N = 5). Corresponding transverse view is shown below.
-
K
Longitudinal view of T. mirabilis STA centered on the A‐C linker, from the viewing point indicated in (I). Microtubule protofilaments A8/A9 and C9/C10 of two adjacent triplets are indicated, as are the connected A‐ and C‐links. The average distance between A‐ and C‐links is 8.4 ± 0.9 nm (N = 6) and 8.4 ± 0.3 nm (N = 5), respectively. Corresponding transverse view is shown below; chevrons point to connections.

