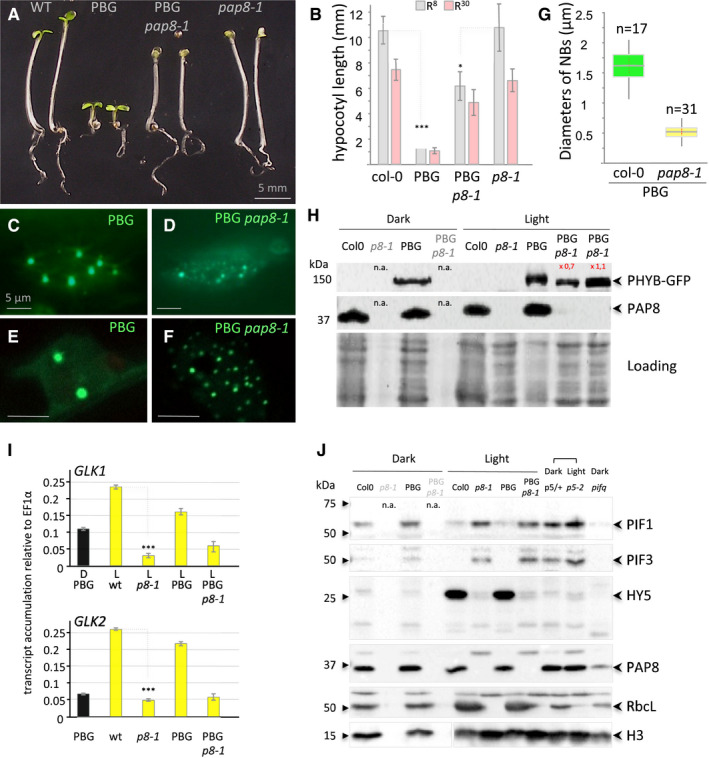
Figure 5. PAP8 is essential for the PHYB‐mediated light induction of photomorphogenesis.

-
APhenotypes of given genotypes subjected to 5 days of illumination at 8 μmol m−2 s−1 660‐nm red light. PBG, pCaMV35S::PHYB‐GFP transformed in pap8‐1/+ (among 25 lines selected for GFP expression see data source; 2 doubly heterozygous pap8‐1/+; PBG/− lines #6 and #7 segregated the photobodies alteration with the albinism).
-
BHypocotyl length, given as the mean ± SD, of plants grown as in (A) (R8, grey bars) or at 30 μmol m−2 s−1 660‐nm red light (R30, pink bars) showing partial insensitivity of pap8‐1 to the PBG overexpression. Measurements are given in source data; in the order of the graph n equals (50, 133, 58, 43, 36, 112, 25, 60) δ‐test (comparison of the mean) R8: δPBG/PBGp8‐1 = 20.38 corresponding to P‐value < 10−31 δwt/p8-1 = 0.5 < 1.96 not significant at α set to 0.05).
-
C–GNuclear accumulation of PBG observed under GFP excitation in the given genotypes. (C, D) Epi‐fluorescence microscopy. (E, F) Confocal microscopy showing the size of the nuclear bodies. Scale bars equal 5 μm. (G) Box plot (Min, 1st quartile, median as the central band, 3rd quartile, max) on the diameter of the nuclear bodies (NBs); n equals the number of records.
-
HImmuno‐blots using a GFP antibody or a PAP8 antibody showing, respectively, the levels of PHYB‐GFP and PAP8 in the given genotypes grown in the dark for 3 days or in light; n.a., not applicable as the pap8‐1 mutant can only be visually distinguished from wild type after light exposure; 2 lines (L#06 and L#07) for PBG/pap8‐1 were tested. Coomassie blue staining presented as loading; signals were quantified using ImageJ.
-
IRT–qPCR analysis on wild type, pap8‐1, PBG and PBG pap8‐1. Seedlings were grown in the dark (D) or under white light (L, 30 μmol m−2 s−1); levels of transcripts are given relative to EF1α; error bars correspond to standard errors on technical triplicates, and the dark sample is the wild‐type PBG line. δ‐test (comparison of the mean) ***P < 10−72.
-
JImmuno‐blots showing the levels of PIF1, PIF3 and HY5 in given genotypes grown in the Dark or light condition as noted: p5/+, mix of an heterozygous pap5‐2 siblings progeny undistinguishable from wild type; p5‐2, pap5‐2 and pifq, quadruple pif1‐1 pif3‐3 pif4‐2 pif5‐3 mutant; histone H3 (H3), RbcL and PAP8 were used as controls; n.a., not applicable.
Source data are available online for this figure.
