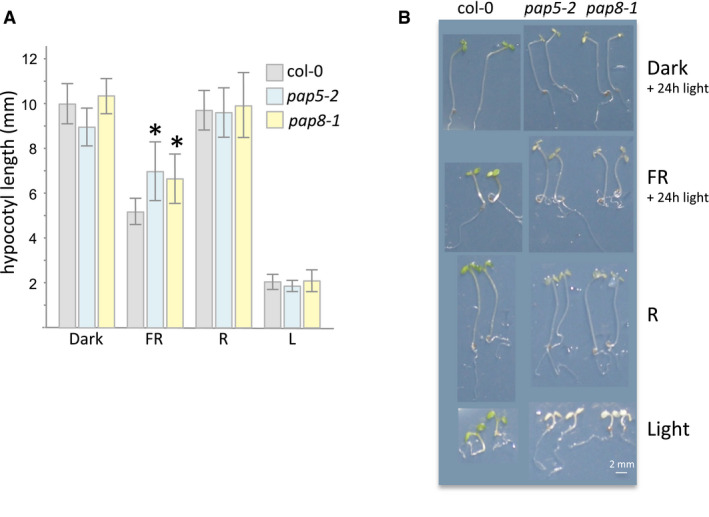
Figure EV5. Hypocotyl growth experiment.

-
AHypocotyl length measurements, given as mean ± SD, of genotypes grown under different light sources. Individual measurements and sample sizes are given in source data. Dark, true dark treatment; FR, far‐red light (low fluence approx. 10 μmol m−2 s−1; peak at 730 nm ± 10 nm); R, red light (8 μmol m−2 s−1 peak at 660 nm ± 10 nm); L, white light 30 μmol m−2 s−1. Whereas pap5‐2 and pap8‐1 are statistically undistinguishable using δ‐test for the comparison of the mean (Fisher Yates δ = 0.791 ≪ Uα = 0.05 = 1.96, not significant at α set to 0.05), both pap5‐2 and pap8‐1 show significant hypocotyl differences compared with wild type (δ = 5.374; δ = 5.061 respectively so that both *P‐values < 10−6).
-
BImages of representative seedlings.
Source data are available online for this figure.
