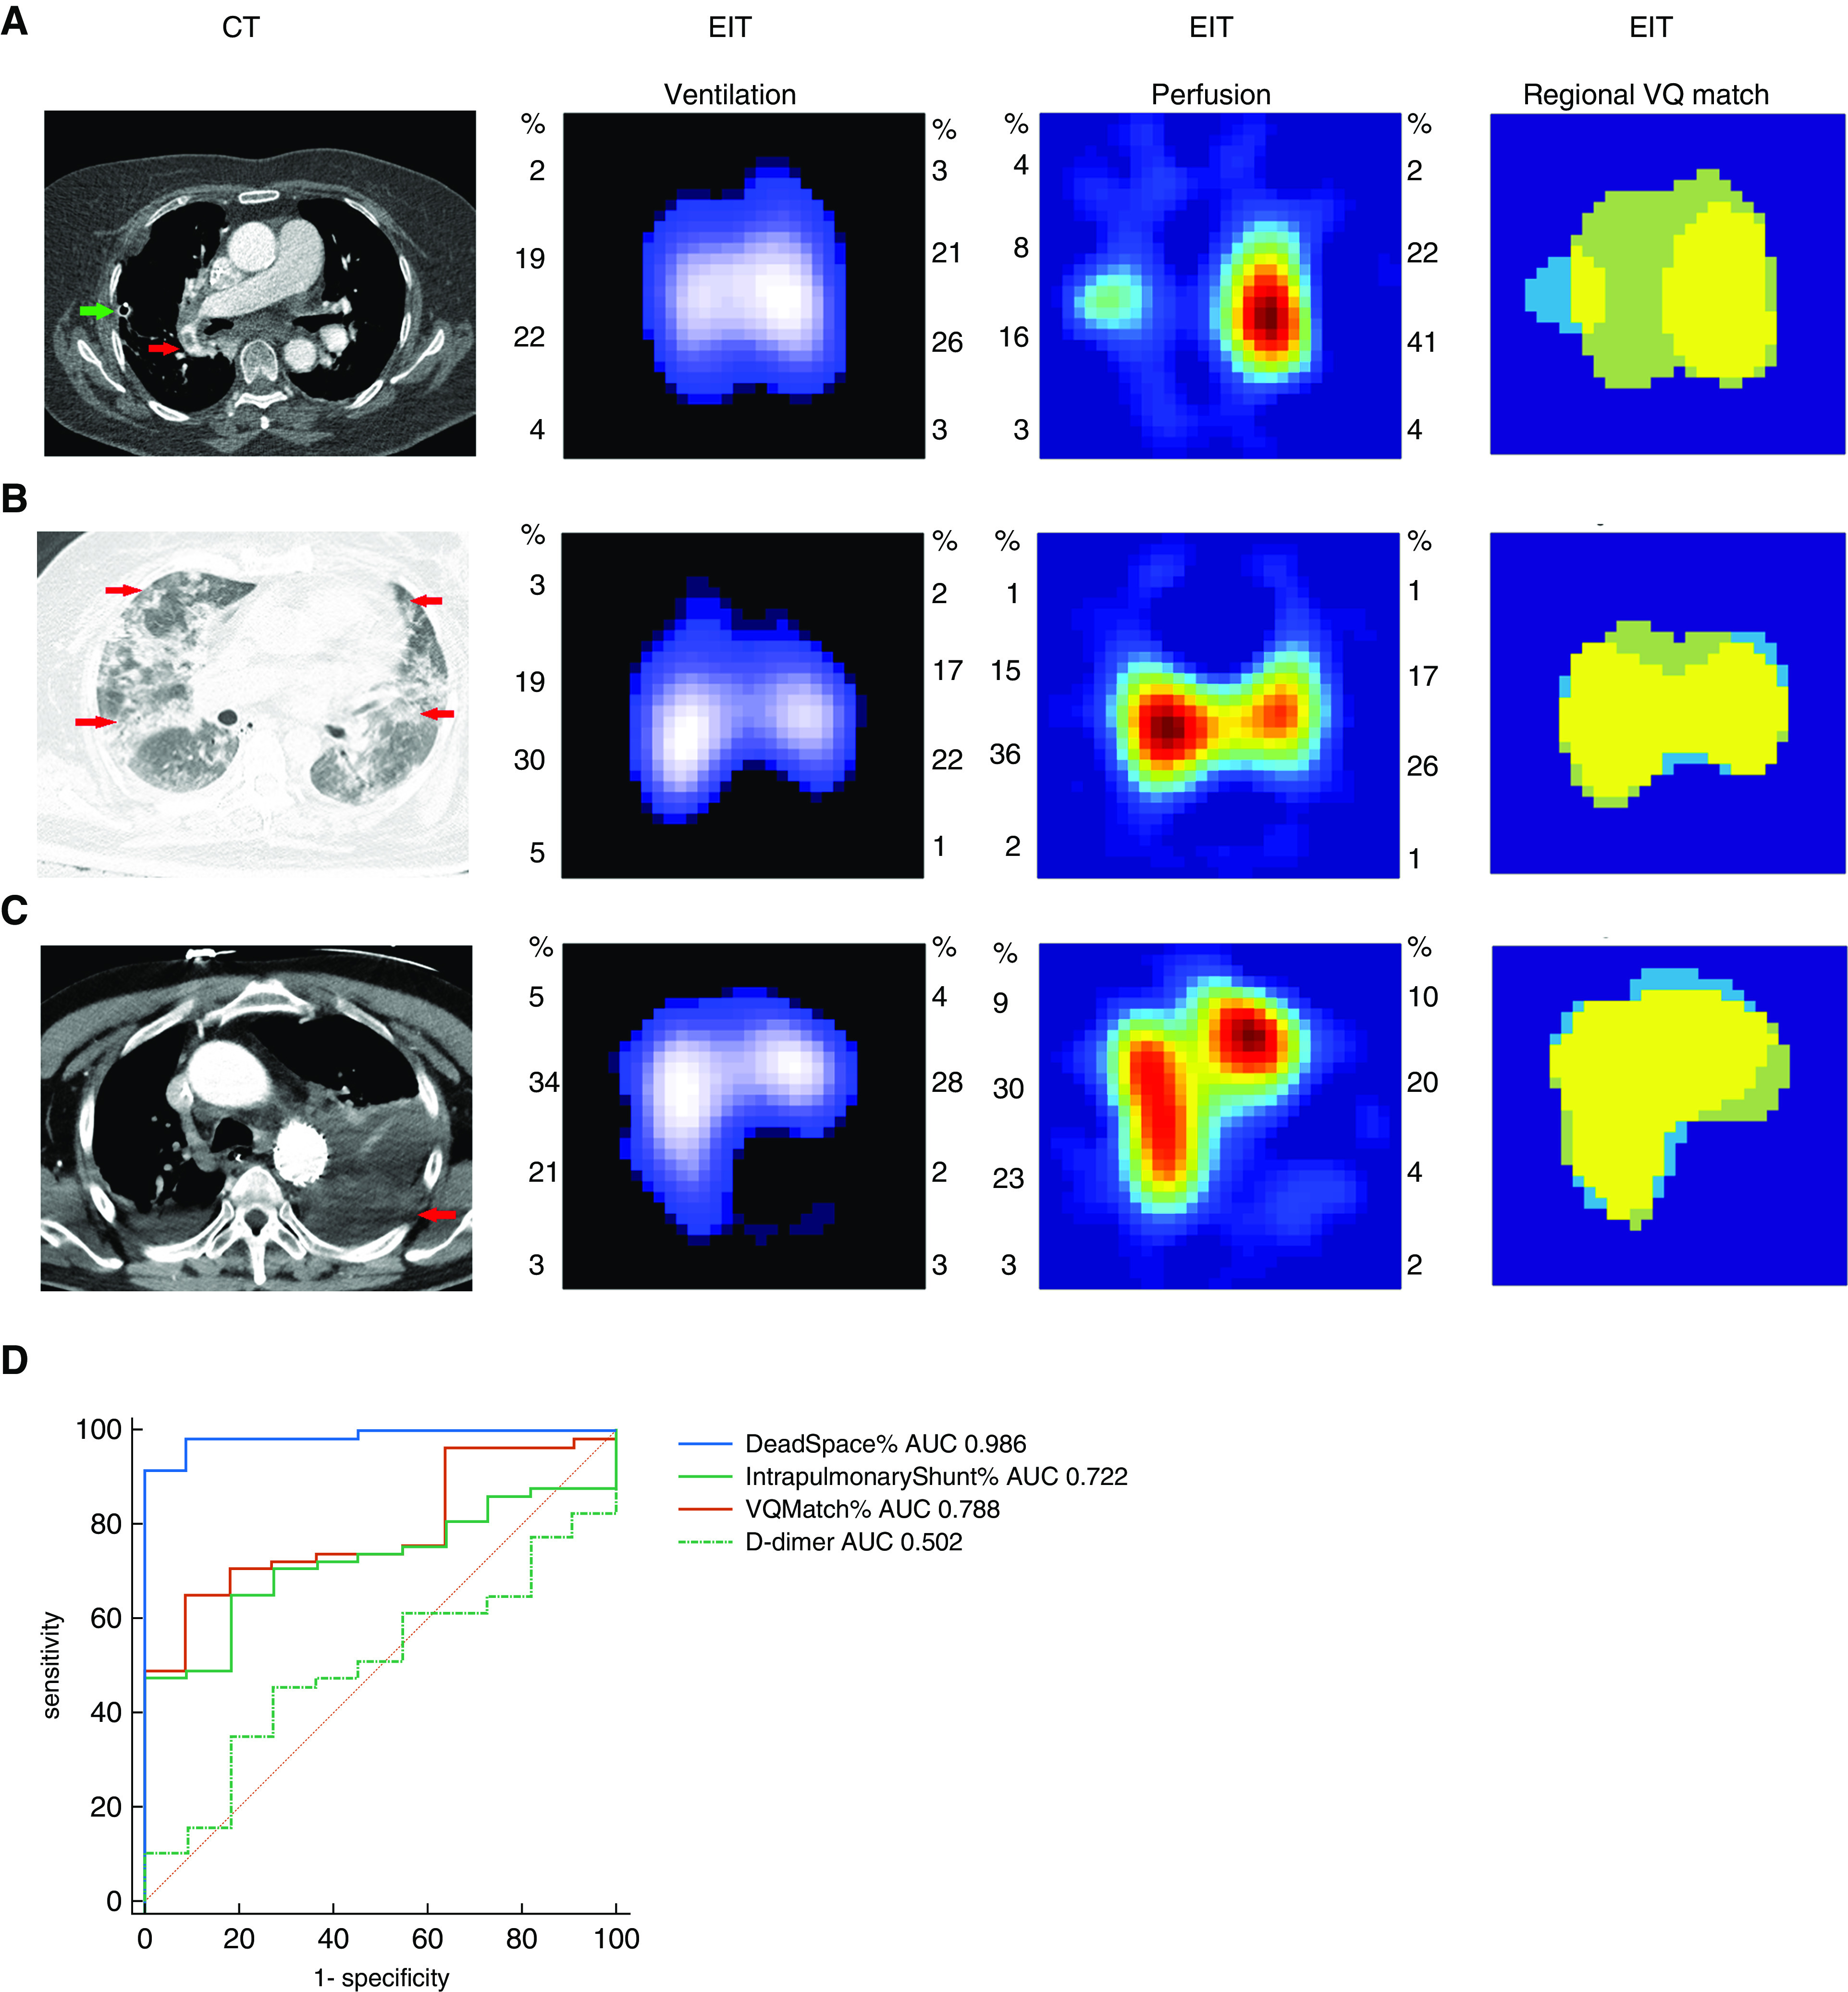
Figure 1.

(A) Computed tomographic (CT) pulmonary angiography and electrical impedance tomography measurement of a patient, who developed acute pulmonary embolism after left upper lung lobe resection. In the CT pulmonary angiography image, the red arrow shows an embolus in the right pulmonary artery. Ventilation and perfusion images indicated poor regional perfusion in the left lung with a normal ventilation distribution. Low-ventilated regions are marked in dark blue and high-ventilated regions in white; regions with high perfusion are marked in red and low perfusion in green. In the match image, dead-space fraction area percentage marked as light green was 54.01%, percentage of intrapulmonary shunt area marked as light blue was 9.50%, and percentage of match region marked as yellow was 36.50%. Please refer to the text for the parameters’ calculation. Green arrow shows a chest tube, which was placed at the end of the surgery. (B) A patient with diffuse lung disease with ground-glass opacity (CT: red arrows show diffuse opacities in both lungs; ventilation and perfusion images: relative normal distribution of regional ventilation and distribution; match image: dead-space fraction was 15.29%, intrapulmonary shunt ratio was 6.27%, and match region percentage was 78.43%). (C) A patient with hemothorax (CT: red arrow shows the hemothorax in the lower left chest zone; ventilation and perfusion images: defects in regional ventilation and distribution in the lower left lung; match image: dead-space fraction was 12.19%, intrapulmonary shunt ratio was 11.25%, and match region percentage was 76.56%). (D) Areas under the receiver operating characteristic curves (AUC) comparing the ability of dead space %, match %, intrapulmonary shunt %, and D-dimer to discriminate pulmonary embolism in the 68 patients. AUC of dead space % was significantly higher than AUC of the other parameters (P < 0.05). EIT = electrical impedance tomography.
