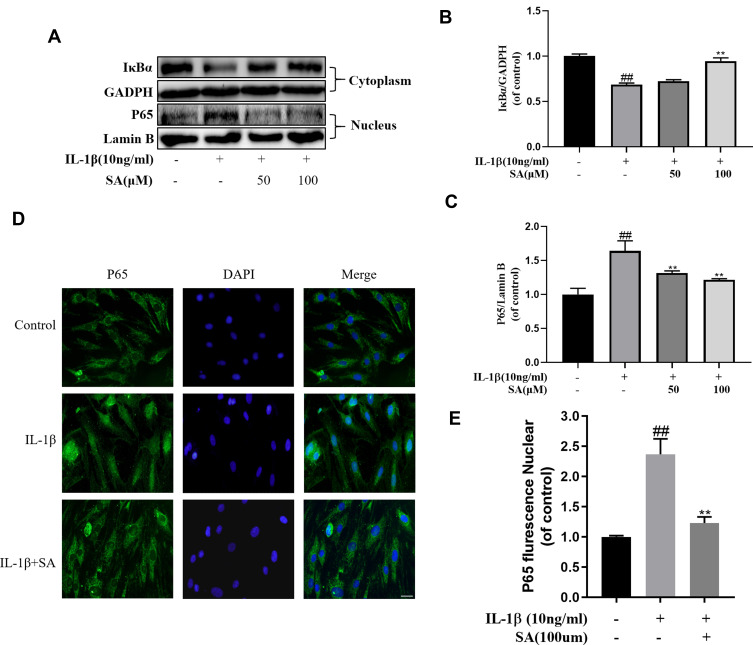
Figure 5.
Effect of SA on IL-1β-induced NF-κB activation. NP cells were pretreated with SA for 24 h and then were treated with IL-1β for another 24 h. (A) The protein expressions of IκBα in cytoplasm and p65 in nuclear in NP cells treated as above were visualized by Western blot. (B–C) Quantification of immunoblots of IκBα and p65. (D) The nuclei translocation of p65 was detected by the immunofluorescence combined with DAPI staining for nuclei (original magnification ×400, scale bar: 25 μm). (E) Intensity of p65 in nuclear of NP cells was quantified. All experiments were performed at least three times, and the data in the figures represent the mean ± S.D. ##P < 0.01 compared with control group. **P < 0.01 compared with IL‐1β group.

