
Fig. 2:
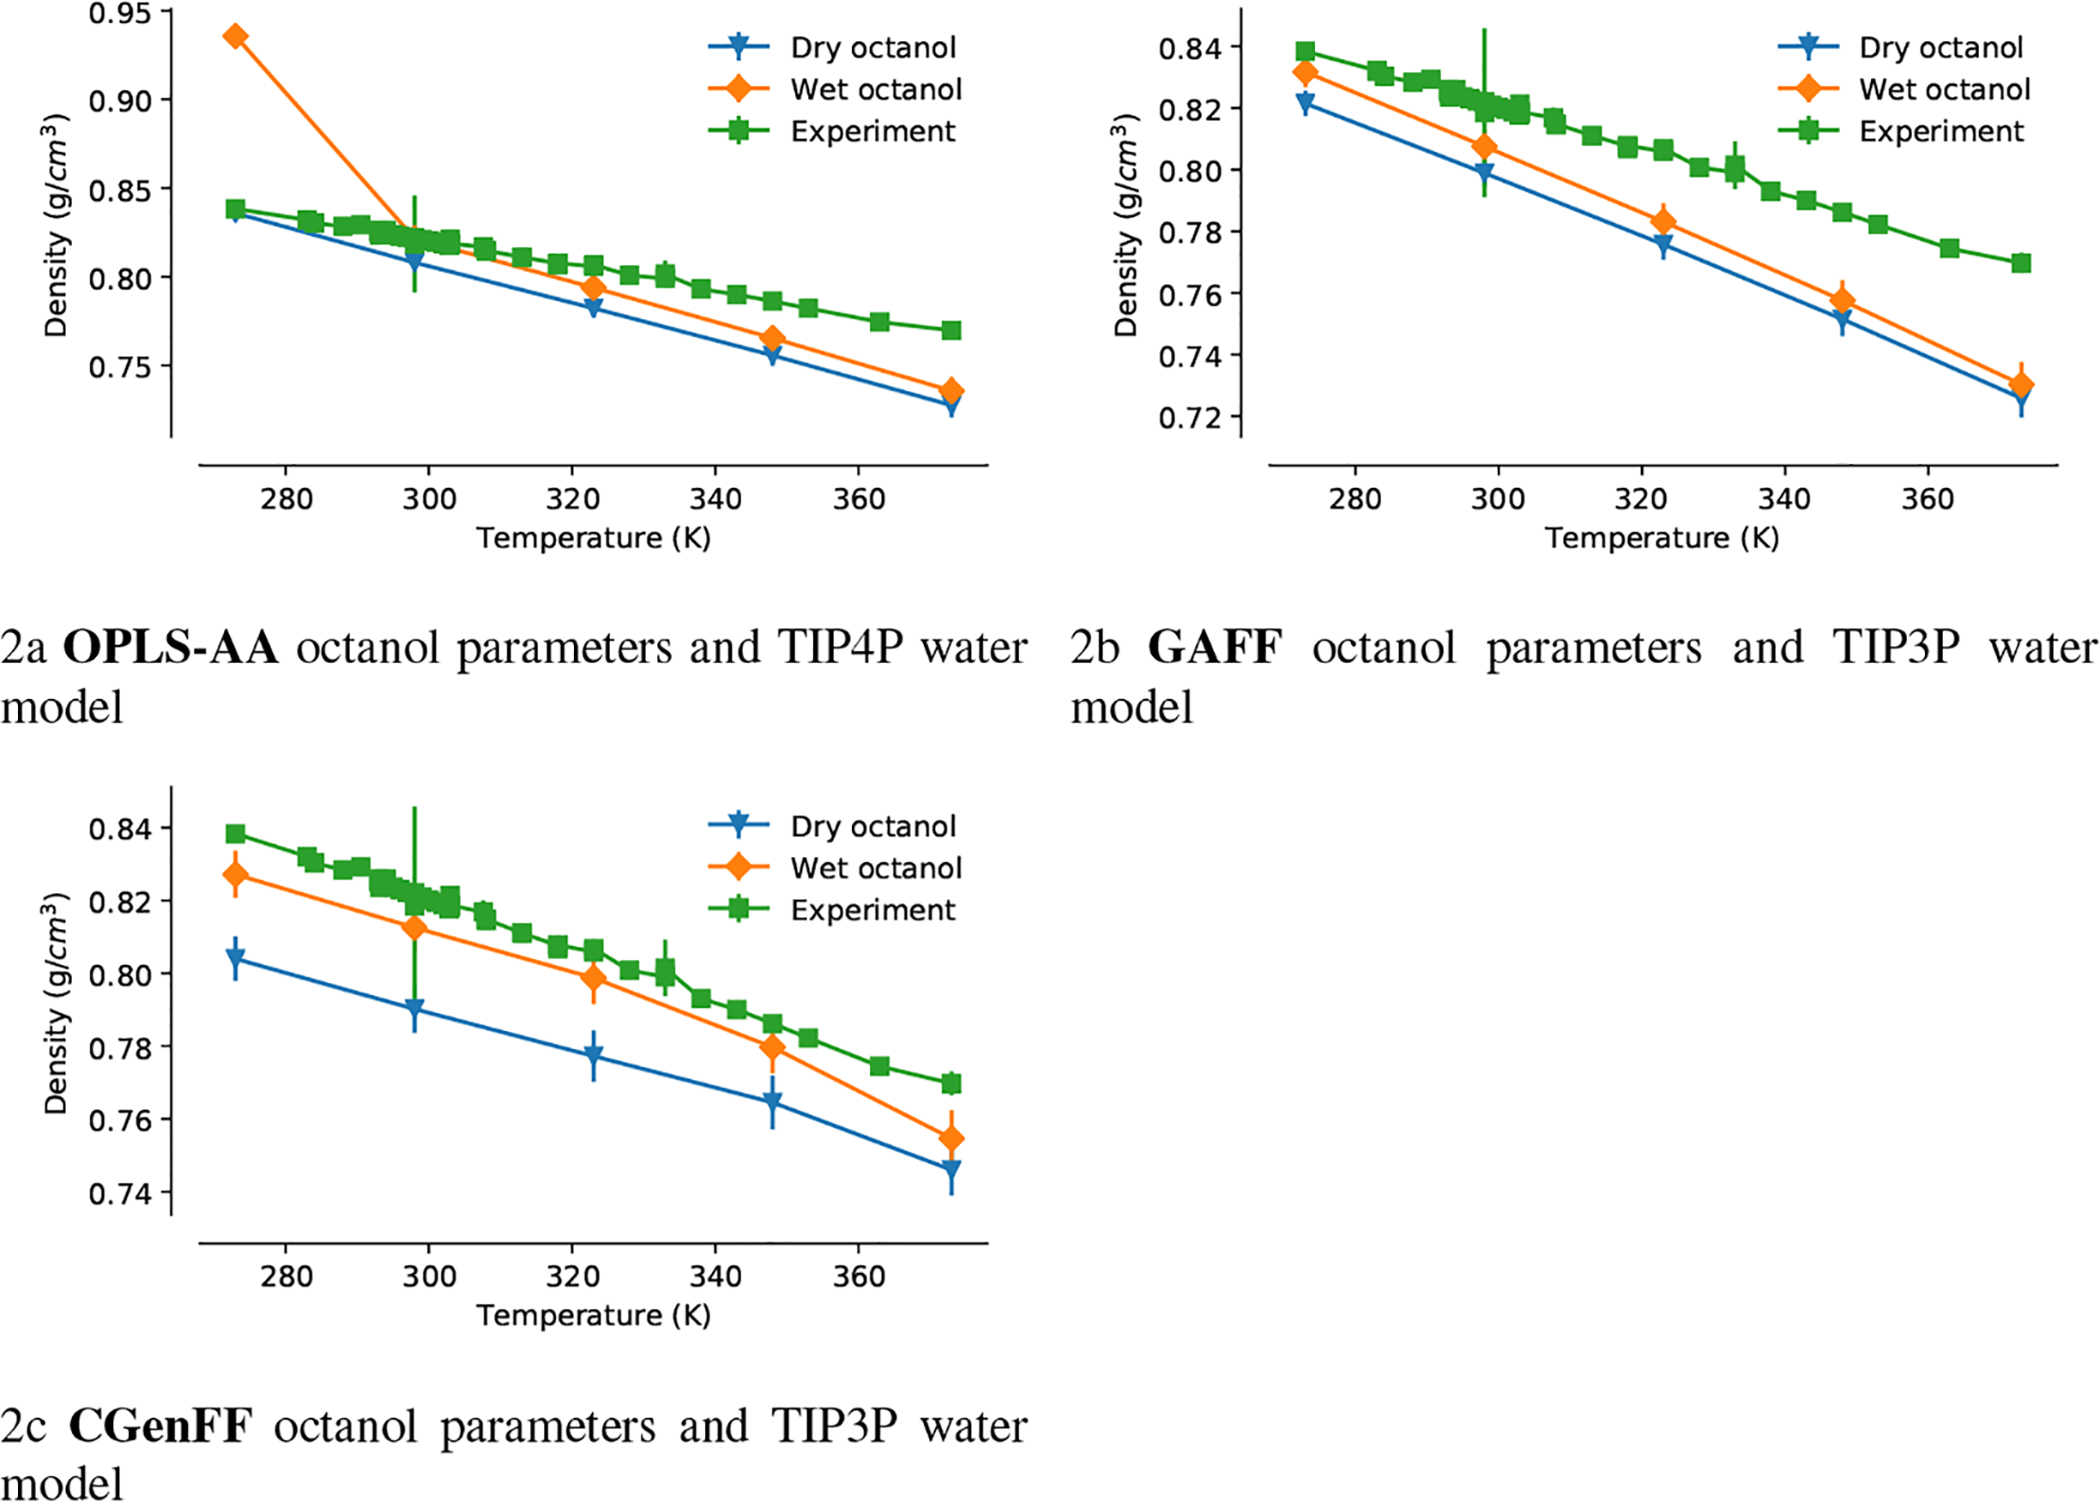
Dependence of the density of dry and wet octanol on the temperature. Green squares are experimental data; blue triangles were computed from 100-ns MD simulations with dry octanol; orange diamonds were computed from 100-ns MD simulations with wet octanol