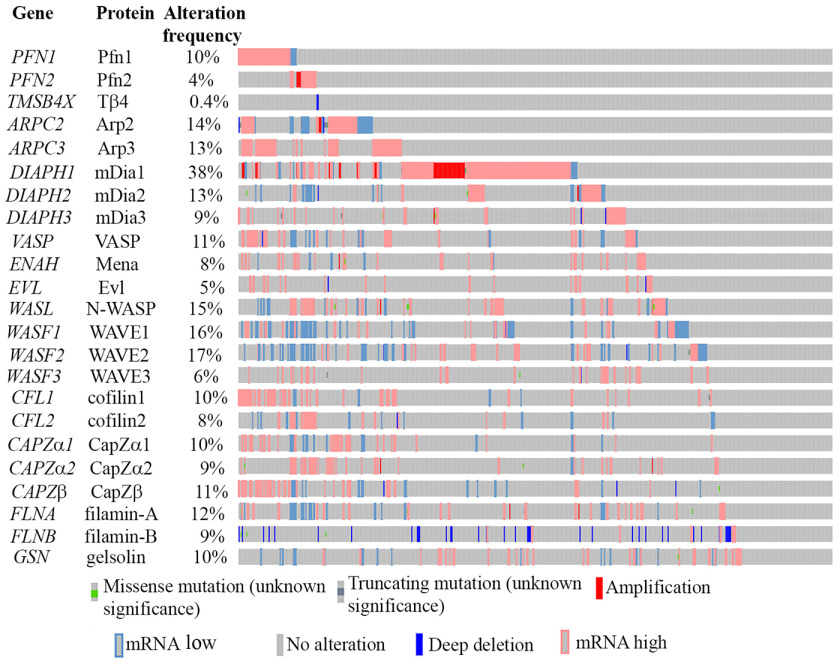
Figure 1.
A graphical summary of alteration of different classes of ABPs assembled from the transcriptome data of 537 ccRCC patients (TCGA data set plotted on cBioportal). Each vertical line represents a clinical case. For these analyses, an absolute value of mRNA expression z score of >1.5 was used as a cutoff for defining overexpression and down-regulation with the mean and variance calculated based on the expression distribution of tumors diploid for any given gene.

