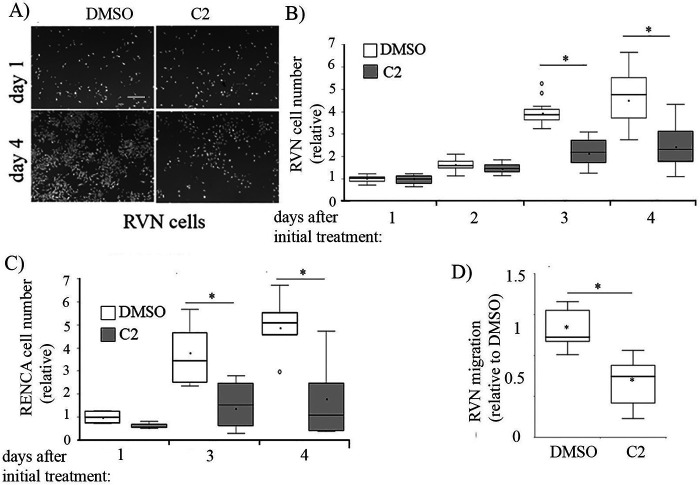
Figure 6.
Effect of small molecule inhibitor of Pfn1–actin interaction C2 on RCC cell proliferation and migration. A–C, box plots summarizing the effect of treatment with 50 µm C2 versus DMSO (control) on proliferation of VHL-negative RVN cells (B; A shows representative images of DAPI-stained cultures on indicated days with scale bar indicating 200 μm), and VHL-positive RENCA cells (C). C2 was added either on the day of seeding (D0, or RVN cells) or 1 day after seeding (D1, for RENCA cells) and was replenished either daily (for RVN cells) or every alternate day (for RENCA cells) during the culture period. Proliferation data are normalized to cell count of the control (DMSO-treated) group of cells. D, box plot summarizing the effect of C2 versus DMSO treatment on serum-induced chemotactic migration of RVN cells (results of three independent experiments). *, p < 0.05.

