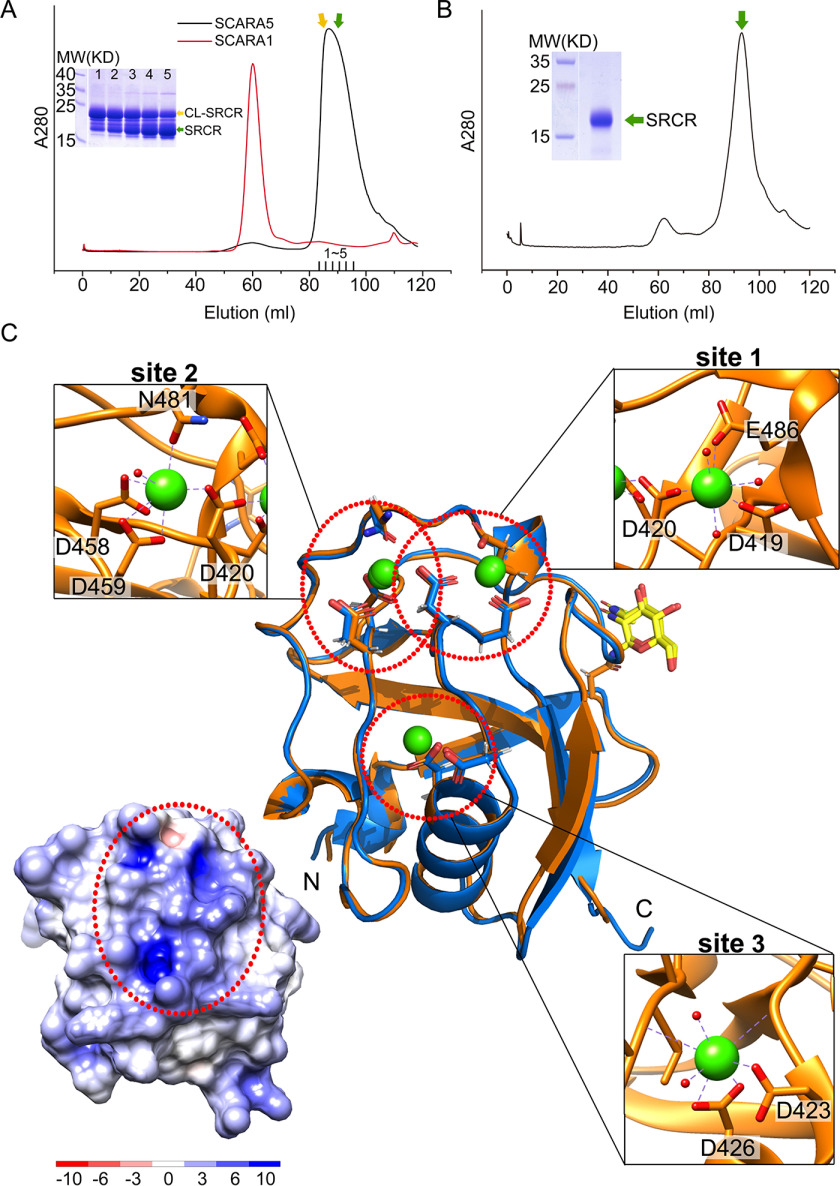
Figure 2.
Crystal structures of the SRCR domain of SCARA5. A, SEC profiles of the CL-SRCR fragments of mSCARA1 and hSCARA5 and the SDS-PAGE of the CL-SRCR fragment of hSCARA5 from the SEC elution peak (fractions 1–5), showing the CL-SRCR fragment (orange arrow) as well as the SRCR fragment resulting from degradation (green arrow). B, SEC profile and SDS-PAGE of the CL-SRCR fragment of hSCARA5 after 36 h of degradation, resulting in an SRCR fragment for crystallization (green arrow). C, superposition of the crystal structures of human (orange) and mouse (blue) SRCR domain of SCARA5. Three Ca2+-binding sites (dashed red circles) are zoomed in at insets (Ca2+ are shown as green spheres; water molecules are shown as small red spheres), respectively. The glycans (N-acetylglucosamine, NAG) are colored in yellow. The surface electrostatic potential of the SRCR domain of hSCARA5 is shown (bottom left) with the same orientation as the crystal structure; the positively charged region is indicated by the dashed red oval.

