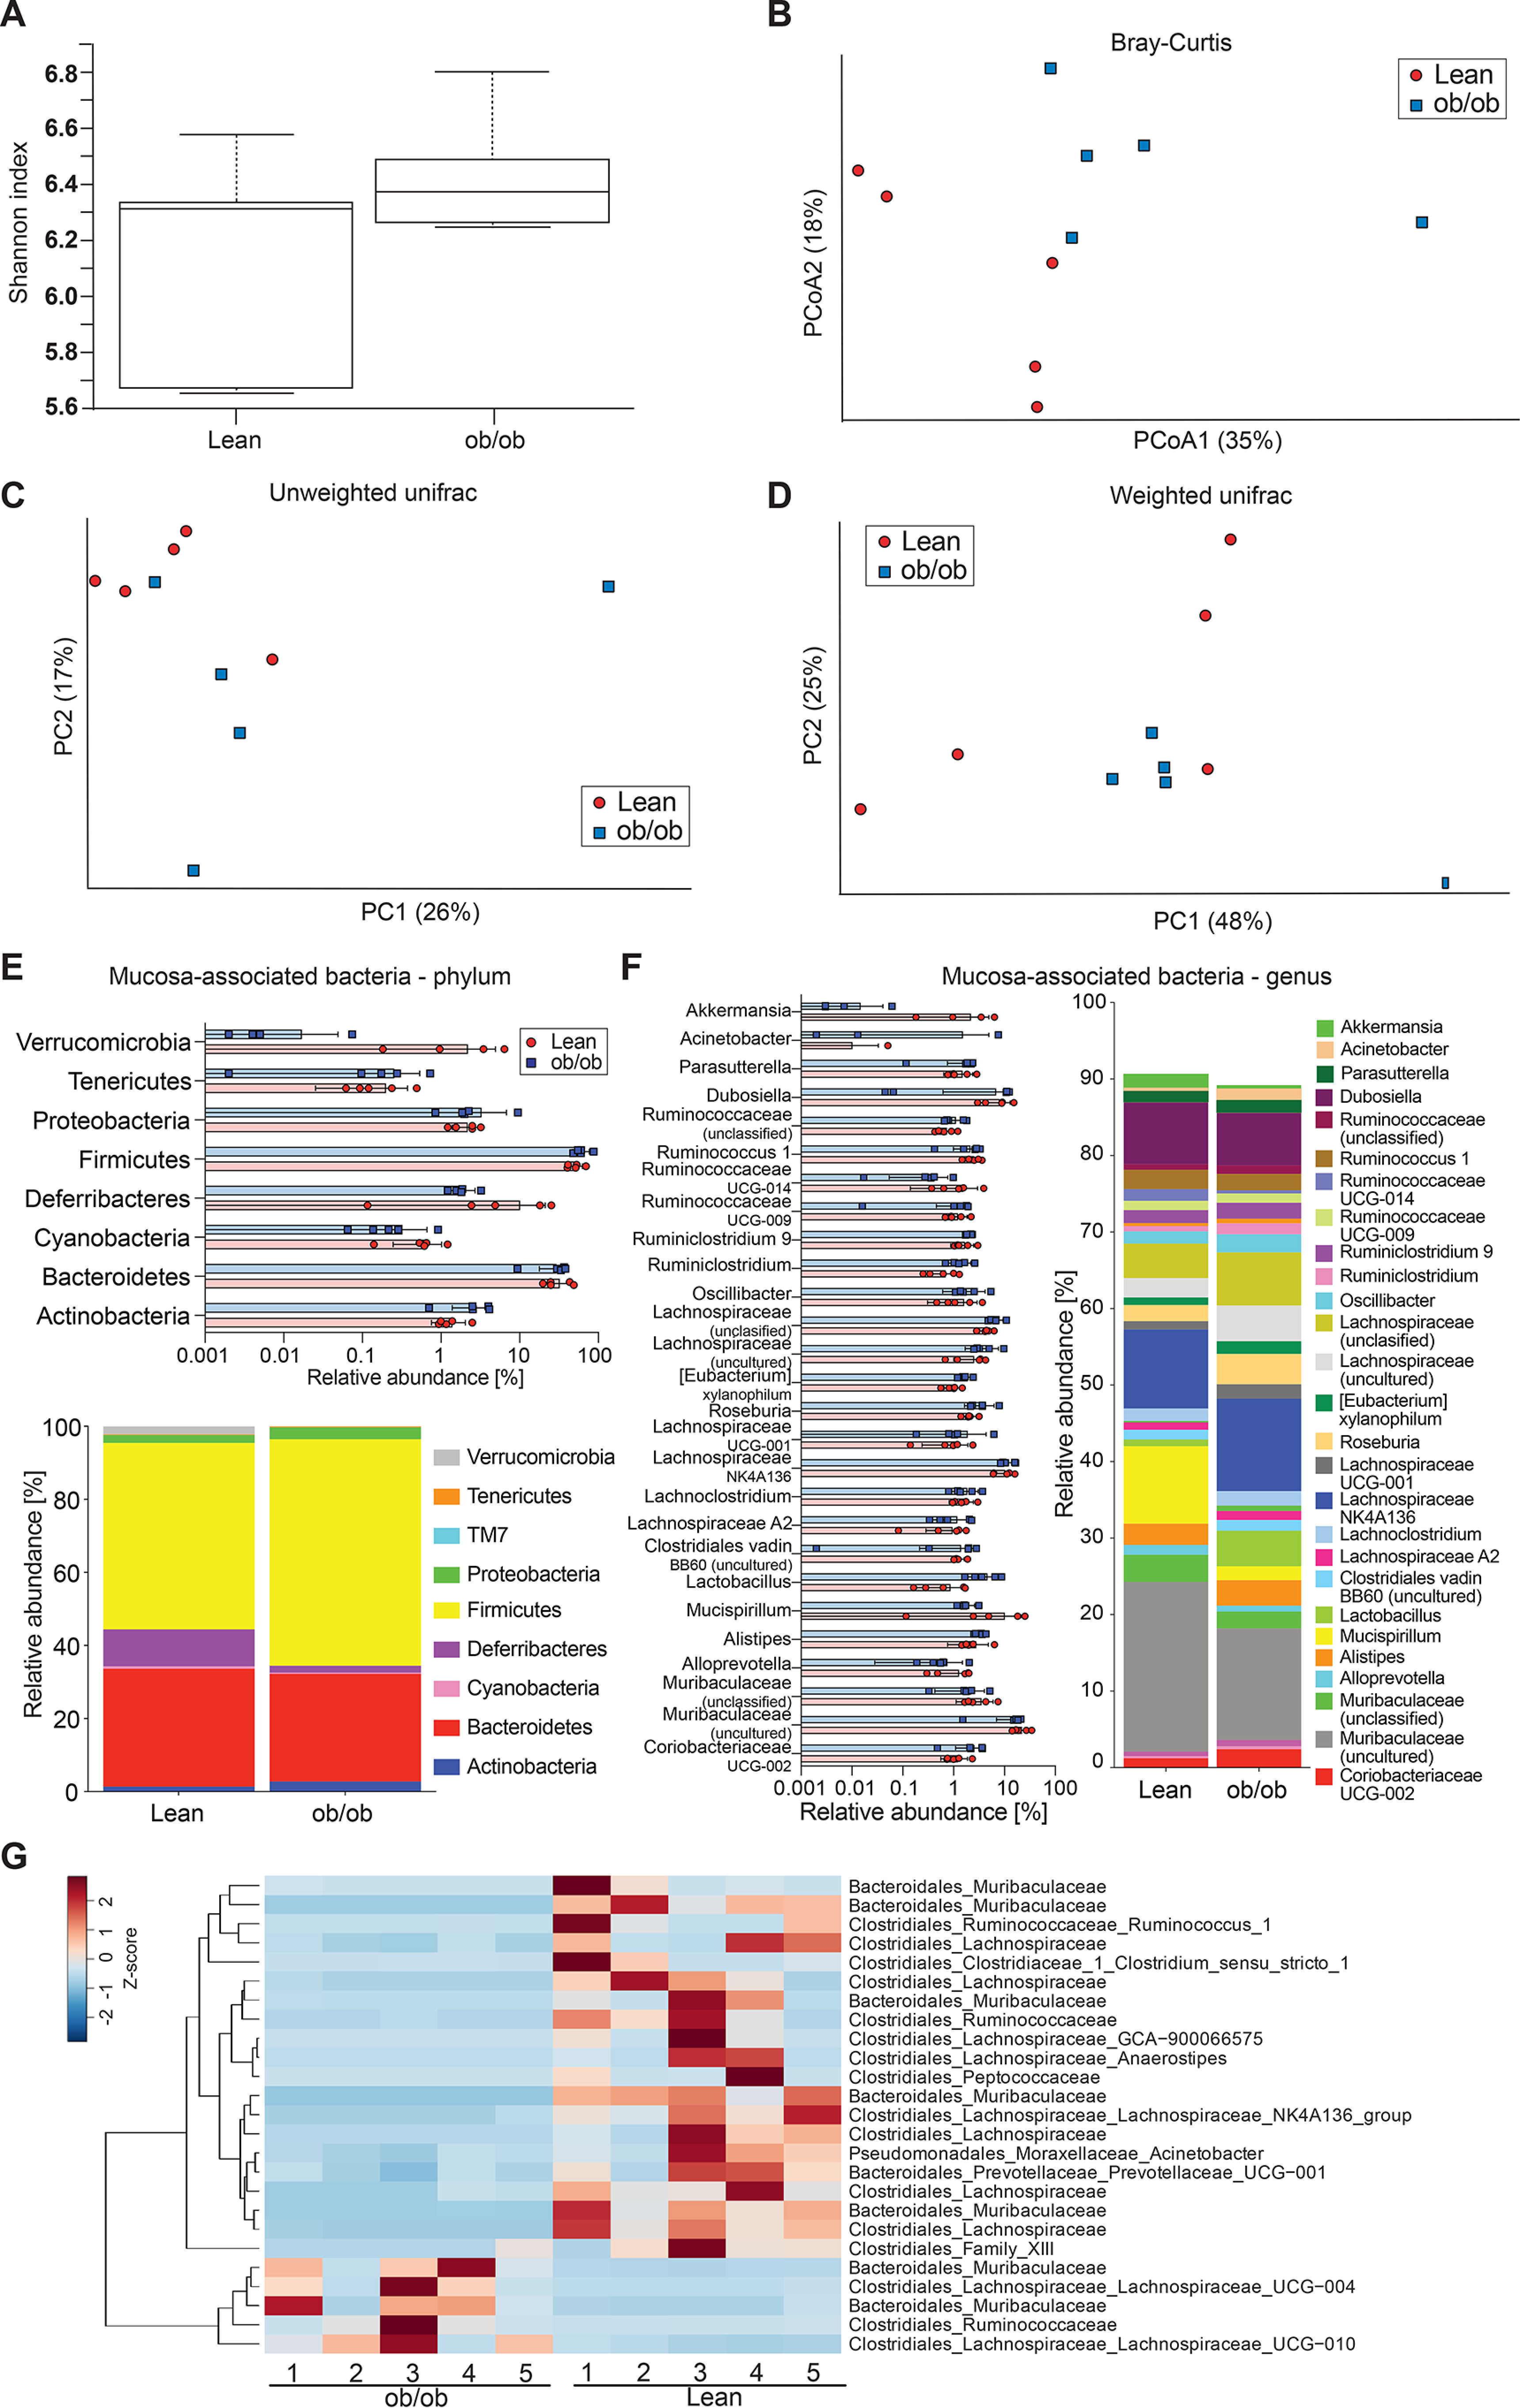
Figure 3.

Gut microbiota analyses at the colonic mucosal surface. A–D, α-diversity (Shannon index, A) and β-diversity (Bray-Curtis dissimilarity matrix, B; unweighted (C) and weighted (D) UniFrac distance matrices) for the mucosa-associated microbial community of genotype-separated lean and ob/ob mice (n = 5 mice per genotype). Statistically significant difference was tested with Kruskal-Wallis test with: *, p ≤ 0.05 for α-diversity (A) and with PERMANOVA and 999 permutations for β-diversity (B–D). E and F, relative abundance of microbial taxa on phylum (E) and genus level (F). In the colored bar representation, microbial taxa with an abundance >1% are shown. G, heatmap showing the differentially abundant ASVs at the colonic mucosa of genotype-separated ob/ob and lean mice. Heatmap is based on hierarchical clustering of the differentially abundant ASVs calculated using DESeq2 (Wald test, FDR < 0.05).
