Figure 7.

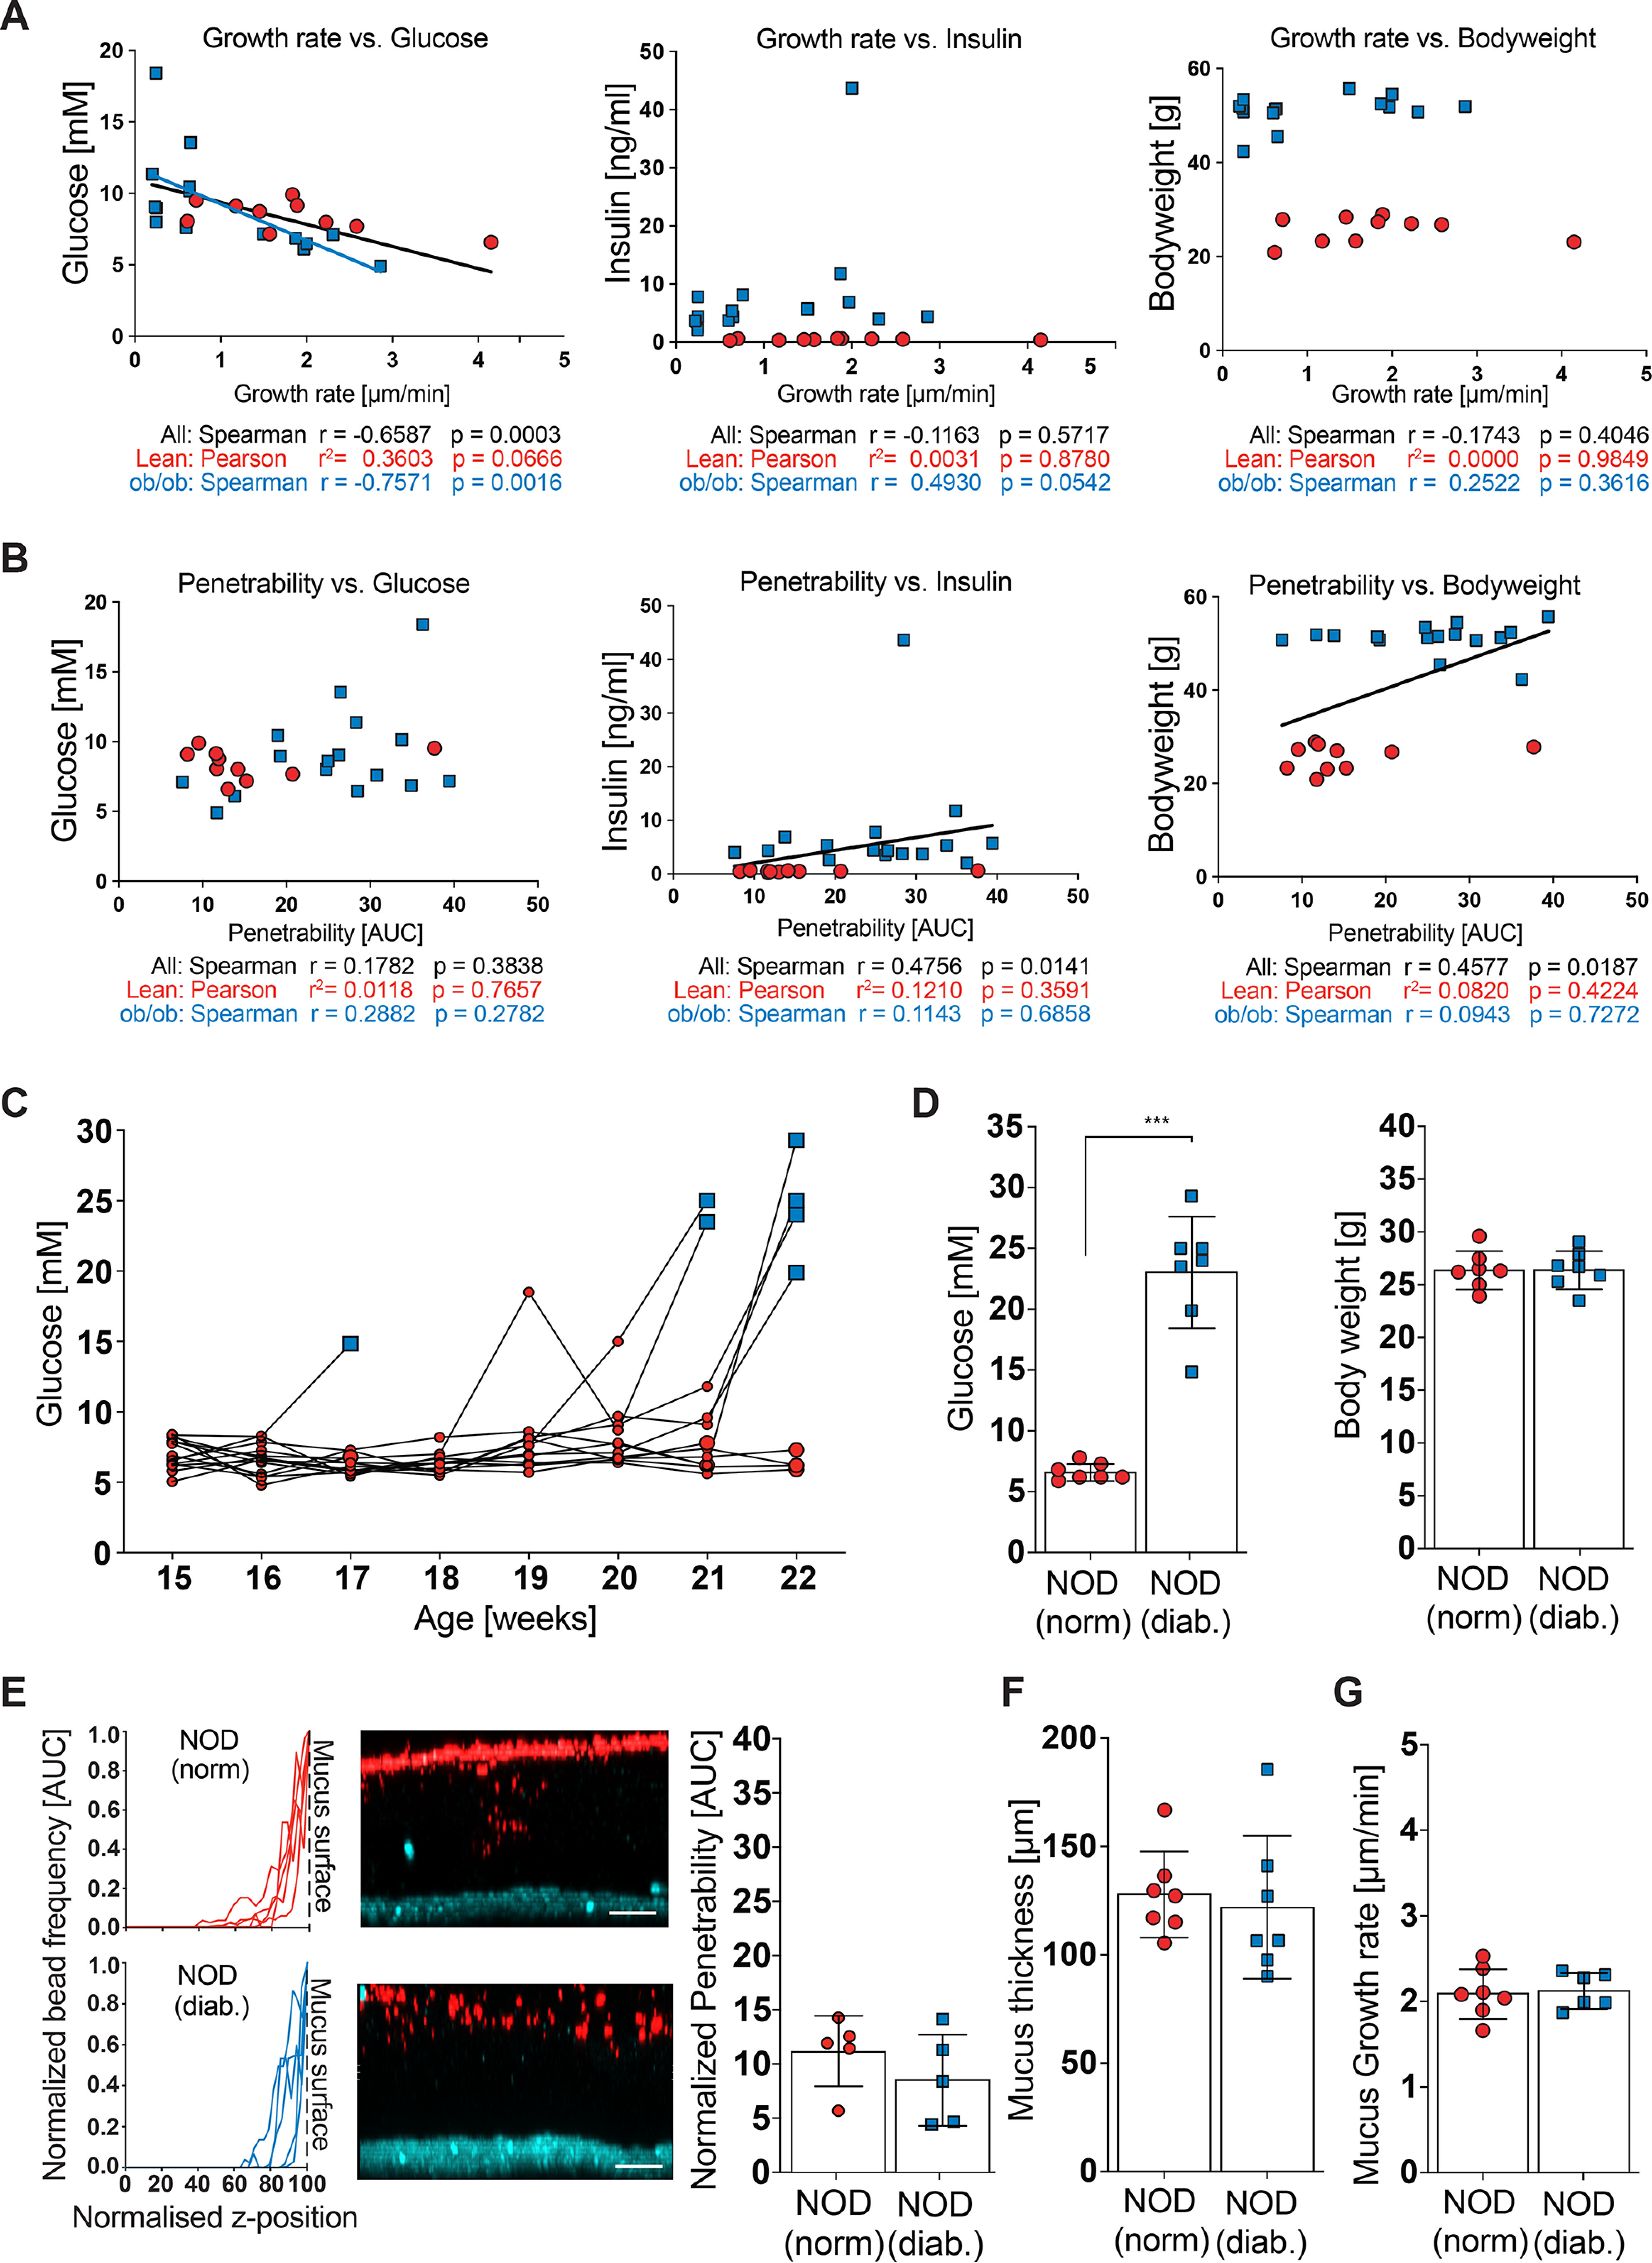
Mucus function and glucose metabolism. A and B, mucus growth rate (A) and mucus penetrability (B) were correlated with fasting blood glucose (left), blood insulin concentration (center) and body weight (right) (n = 10-15 mice per genotype). Pearson (normally distributed data) or Spearman (not-normally distributed data) correlation analysis was used to test correlations between metabolic phenotypes and mucus function. A black regression line indicates significant correlation with all samples, whereas a blue line indicates significant correlation within the ob/ob group. C, post-prandial glucose levels of normoglycemic (red) and diabetic (blue) NOD mice were measured weekly. Time points of sacrifice/mucus measurement have enlarged symbols. D, post-prandial glucose levels and body weight of normoglycemic (norm.) and diabetic (diab.) NOD mice before mucus analyses (n = 7 mice per genotype). E, mucus properties in the distal colon. From left to right: the position of fluorescent 1-μm beads, obtained from confocal z-stacks, were used to determine penetrability of the inner colonic mucus layer. Turquoise, intestinal tissue; red, 1 μm bacteria-sized beads. Scale bar = 50 μm. F, thickness and growth rate (G) of the mucus layer was measured ex vivo with a micromanipulator by measuring the distance between black 10-μm beads and the epithelial surface (right) (n = 7 mice per group). Data in D–G are presented as mean ± S.D. *, p ≤ 0.05; **, p ≤ 0.01; ***, p ≤ 0.001 (Mann-Whitney U test). E, for the normalized bead frequency (left), the median bead frequency distribution is shown for each mouse.
