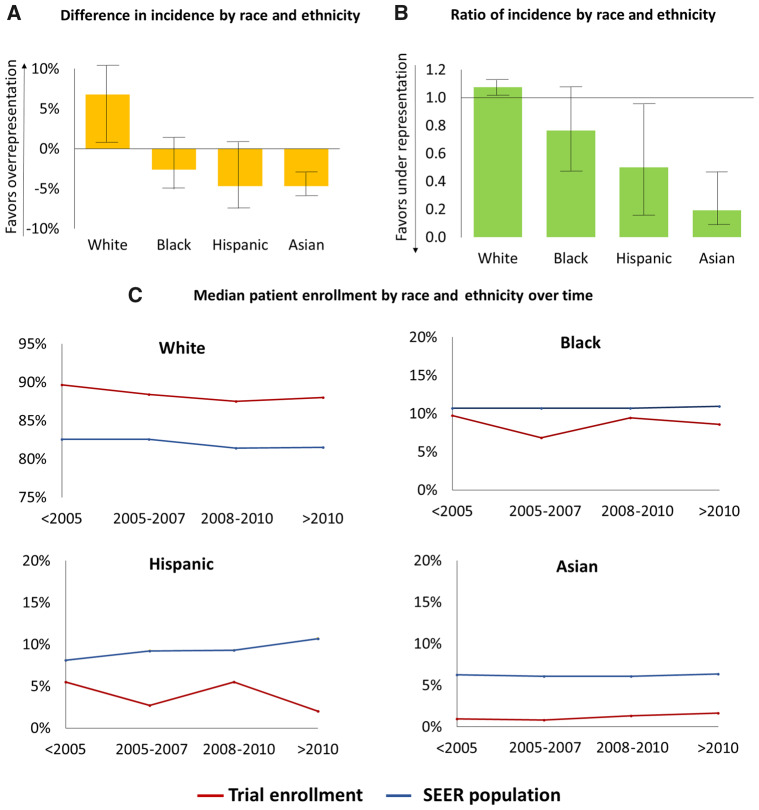
Figure 1.
Median difference in incidence by race and ethnicity with interquartile range shown with error bars (A), median ratio of incidence by race and ethnicity with interquartile range shown with error bars (B), and median proportions of race and ethnicity compared with Surveillance, Epidemiology, and End Results (SEER) estimates (C).

