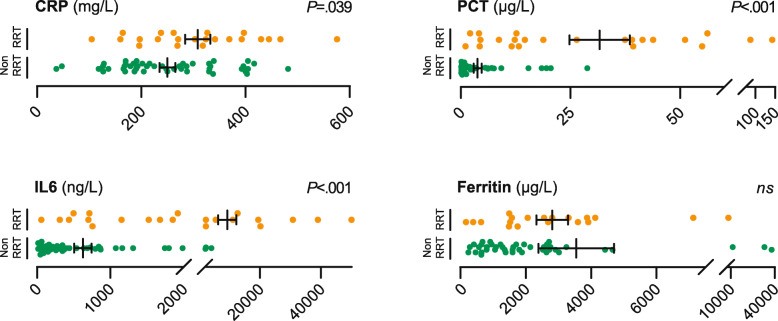
Fig. 1.
Distribution of inflammation markers in COVID-19 RRT- and Non-RRT-cohort. Dot plots show levels of selected inflammation markers CRP, PCT, IL6, and Ferritin. Orange dots ( ) represent individual patients who underwent CVVHD or SLEDD. Green dots (
 ) represent patients who were not treated with RRT. Bars depict mean and standard error of the mean (SEM). P-values were calculated using a two-tailed student’s t-test. ns: not significant with α = .05. CRP available from n = 22 / n = 47 (RRT- / Non-RRT-cohort); PCT n = 23 / n = 48; IL6 n = 22 / n = 46; Ferritin n = 19 / n = 42

