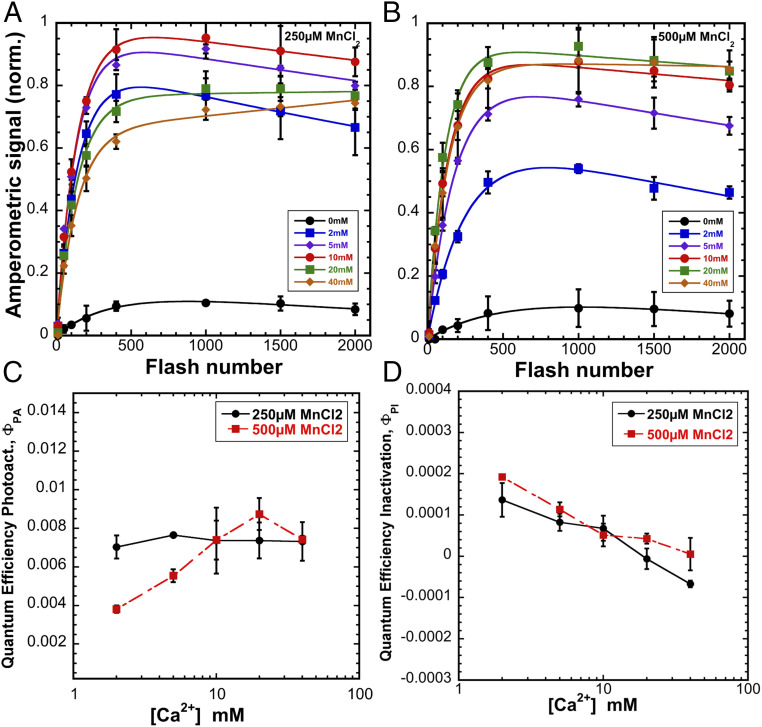
Fig. 2.
Calcium dependence of photoactivation under sequence of single turnover flashes at 2 Hz (500-ms flash interval) of HA-extracted thylakoid membranes from WT control at 0 (black circle), 2 (blue square), 5 (purple diamond), 10 (red circle), 20 (green square), and 40 (orange diamond) mM of CaCl2 combined with 250 μM (A) or 500 μM MnCl2 (B). (C) Overall quantum efficiency of photoactivation (ΦPA). (D) Quantum efficiency of inactivation (ΦPI). Data were fit to Eq. 1 for parameter estimation. Error bars represent SD with n ≧ 3.

