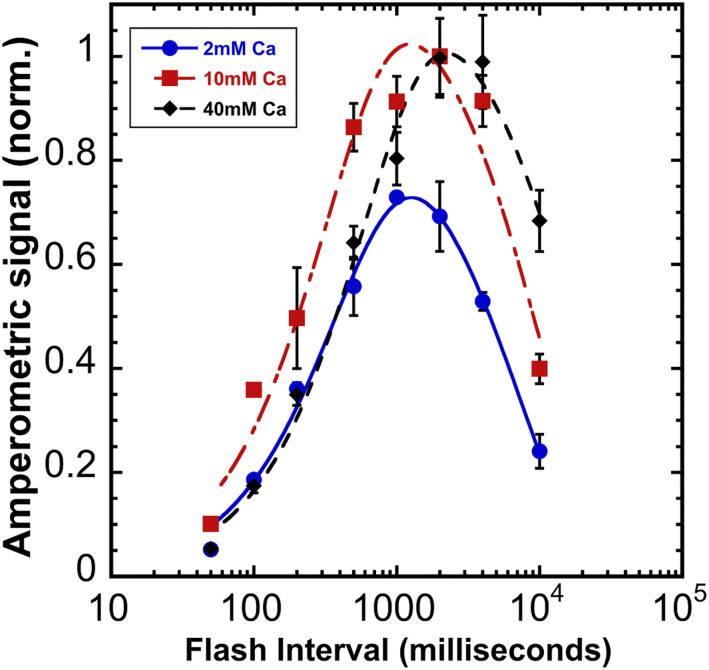
Fig. 3.
Photoactivation yields as a function of flash interval at different calcium concentrations. Sequences of 150 Xe flashes applied at different flash intervals to HA-extracted thylakoid membranes from WT control and oxygen yields measured on a bare platinum electrode. Plots correspond to samples containing 2 (blue circle), 10 (red square), and 40 (black diamond) mM of CaCl2 a fixed [Mn2+] = 250 μM. Error bars represent SD with n ≧ 3. Data were fit to Eq. 2 to estimate the dark rearrangement constant, kA, and the decay of photoactivation intermediates “B and C,” kD (see Fig. 1 for kinetic model and Table 1 for estimated values for kA and kD).

